What is the average electric bill in California? (2026)
The average California household pays roughly $170 a month at a statewide residential rate of about 33.25¢/kWh — but that statewide average hides a spread of nearly 20¢/kWh between SDG&E and LADWP. Here is what bills actually look like by utility and usage level in 2026.
By Taylor Crouse — Founder, Helios Energy GlobalUpdated
Quick answer
- California's average residential electricity rate is about 33.25¢/kWh as of the most recent EIA monthly data (mid-2026) — roughly 1.8× the US average of 18.44¢, and second-highest of any state behind Hawaii. > - The typical California home uses about 503 kWh/month — roughly 16.5 kWh per day — which puts the statewide average bill near $170. > - That average is close to meaningless on its own. An SDG&E customer pays about 46.4¢/kWh; an LADWP customer pays an effective 26–31¢. Same state, nearly a 20¢ spread.
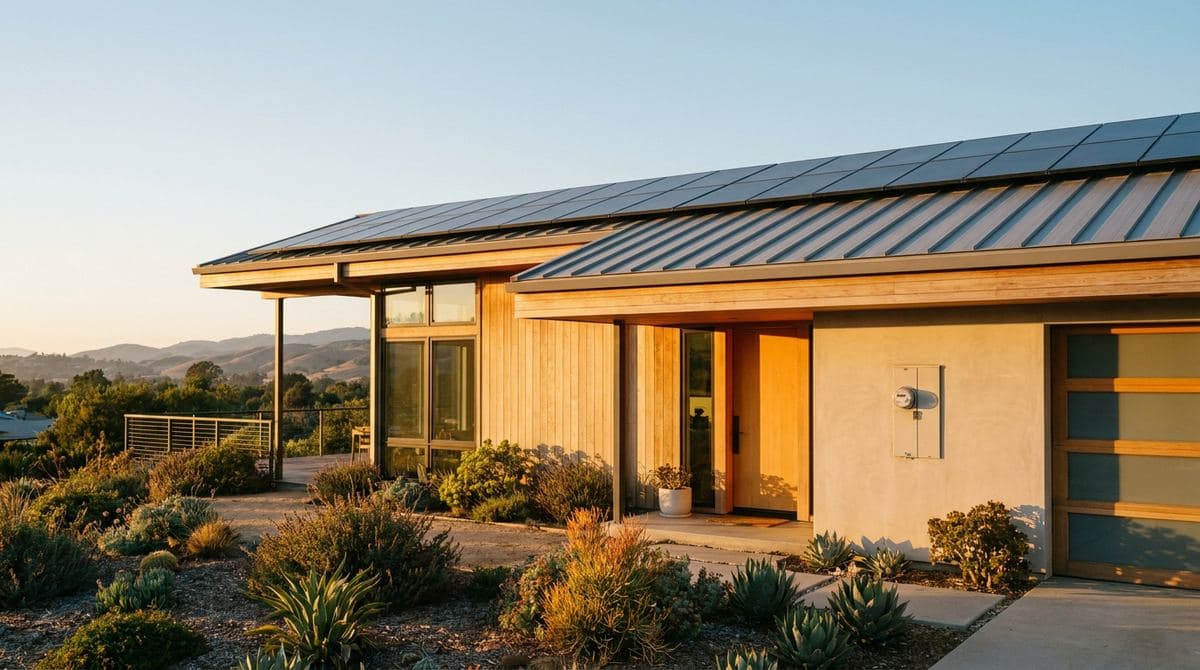
- All three big investor-owned utilities added a Base Services Charge of about $24/month (about $6 on CARE, $12 on FERA) between October 2025 and March 2026, and cut per-kWh rates roughly 10% to offset it. Low-usage homes generally pay more under this structure; high-usage homes pay less. > - Solar removes the volumetric part of the bill, not the fixed part. Under NEM 3.0 the winning design maximizes self-consumption rather than exports.
Ask what the average electric bill in California is and you get a number that's technically correct and practically useless. We design solar systems across Southern California every week, and the single most common thing we see on a first call is a homeowner who read a "$170 average" figure somewhere and is holding a $410 bill, wondering what they're doing wrong. Usually the answer is nothing — they just live in the wrong utility territory with the wrong rate plan.
So this guide gives you the statewide number, and then immediately gives you the number that actually applies to you.
The statewide average, honestly stated
| Metric | California | US average |
|---|---|---|
| Average residential rate | ~33.25¢/kWh (mid-2026 EIA data) | 18.44¢/kWh |
| Rank among the 50 states | 2nd highest (behind Hawaii) | — |
| Typical household usage | ~503 kWh/month | ~863 kWh/month |
| Resulting average bill | ~$170/month | ~$160/month |
Notice the third row of that table, because it is the whole story. California's rate is nearly double the national average, but California's bills are only modestly above average — because California homes use far less electricity than homes in Texas, Arizona, or Florida. Mild coastal weather, a lot of gas heating, and decades of appliance-efficiency standards mean the average California household burns roughly 500 kWh a month against a national norm closer to 860.
Worth dating precisely: EIA's most recent full-year residential data (2024) puts California's actual average bill at $160.86 a month — 503 kWh at 31.97¢/kWh. Since then the statewide rate has drifted to about 33.25¢ as of mid-2026 — unusually, down from roughly 35¢ in 2025, because PG&E cut rates twice while SCE held nearly flat. Run 503 kWh through today's rate and you land near $167; call the 2026 statewide average about $170 a month.
That's the trap. The statewide "average bill" is held down by low usage and by millions of customers on cheap municipal utilities. If you're on an investor-owned utility with real summer heat, the average tells you nothing about your bill.
How many kWh does the average California home use per day?
About 16.5 kWh per day. EIA's 2024 residential data puts the average California home at 503 kWh a month, which works out to roughly 16–17 kWh per day. The average US home uses about 863 kWh a month — call it 28 kWh a day — so a typical California household runs on roughly 40% less electricity than the national norm.
| Usage measure | California average | US average |
|---|---|---|
| Per day | ~16.5 kWh | ~28 kWh |
| Per month | ~503 kWh | ~863 kWh |
| Per year | ~6,000 kWh | ~10,400 kWh |
Why so low? Three structural reasons:
- Climate. Most Californians live within reach of coastal air, and millions of homes in LA, Orange County, and the Bay Area barely run air conditioning — the largest electric load in most of the country.
- Gas does the heavy lifting. Space heating, water heating, and cooking are still mostly natural gas here, so those loads never touch the electric meter.
- Decades of efficiency codes. Title 24 and appliance standards have been squeezing per-home consumption since the 1970s.
And here is the part that matters if you track your light bill — as plenty of Californians still call it — month over month: your usage is probably fine; the price is the problem. A California home using 40% less electricity than the national average still pays a bill about 6% higher, because each of those kilowatt-hours costs nearly twice as much. When homeowners bring us a painful bill, the fix is almost never "use less" — it's changing what each kilowatt-hour costs.
Where daily usage does blow out is inland. A Temecula, Palm Springs, or Fresno home running AC through July and August can pull 1,000–1,500 kWh in a summer month — 33 to 50 kWh a day — and much of it lands in the most expensive hours. To benchmark your own home, how many kWh per month is normal breaks usage down by home size and climate zone.
What bills actually look like, by utility and usage
These are volumetric estimates using each utility's approximate all-in residential average. Your real bill moves with your rate plan (most households are on time-of-use), your baseline allowance, CARE/FERA status, and the twice-yearly California Climate Credit.
| Monthly usage | PG&E (~41¢) | SCE (~35¢) | SDG&E (~46¢) | LADWP (~28¢) |
|---|---|---|---|---|
| 300 kWh | ~$125 | ~$105 | ~$140 | ~$85 |
| 500 kWh | ~$205 | ~$175 | ~$230 | ~$140 |
| 750 kWh | ~$310 | ~$260 | ~$345 | ~$210 |
| 1,000 kWh | ~$415 | ~$350 | ~$460 | ~$280 |
| 1,500 kWh | ~$620 | ~$525 | ~$690 | ~$420 |
For a sanity check on that PG&E column: PG&E's own January 2026 rate advisory puts a 500 kWh non-CARE residential bill at $208.68, or $202.65 after the Climate Credit. CARE customers at the same usage pay $127.79.
The per-utility detail lives in its own guide:
- Average SCE bill in 2026 — the largest customer base in the state
- Average LADWP bill in 2026 — municipal, tiered, and cheaper than its neighbors
- Average electric bill in Los Angeles — where LADWP and SCE territory meet in one city
- Average electric bill in San Diego — the highest rates in the continental US
- Average electric bill in Palm Springs and Temecula — desert and inland-valley cooling loads
- IID electricity rates — the Imperial Valley outlier
If you want to know whether your usage is the problem, start with how many kWh per month is normal.
Which California utility is most expensive?
| Utility | Type | Approximate residential average | Who it serves |
|---|---|---|---|
| SDG&E | Investor-owned | ~46.4¢/kWh (April 2026) | San Diego County, south Orange County |
| PG&E | Investor-owned | ~40–41¢/kWh (after the March 2026 cut) | Northern and Central California |
| SCE | Investor-owned | ~34–35¢/kWh (34.4¢ as of June 2026) | Most of Southern California outside LA city and San Diego |
| LADWP | Municipal | ~26–31¢/kWh effective | City of Los Angeles |
| SMUD, IID, and other munis | Municipal / irrigation district | Generally well below the IOUs | Sacramento, Imperial Valley, and other pockets |
Two structural facts explain almost all of that spread. First, the investor-owned utilities are regulated by the CPUC and earn an authorized return on capital investment — including the enormous ongoing spend on wildfire mitigation, undergrounding, and liability insurance. Municipal utilities like LADWP and SMUD don't earn a shareholder return and carry different wildfire exposure. Second, most of an IOU bill is delivery, not generation, which is why switching to a community choice aggregator trims the bill without transforming it.
On SDG&E's residential rates per kWh specifically: SDG&E's own April 2026 rate alert puts the bundled residential average at 46.4¢/kWh, up from 45.7¢ at the start of the year — a 1.5% bump, partially cushioned by an expanded super-off-peak window on TOU-DR1. That 46.4¢ remains the highest of any major utility in the continental US.
PG&E rates did come down on January 1, 2026 — from 44.36¢ in September 2025 to 41.46¢ — and came down again on March 1, 2026, the fifth decrease since early 2024, worth about another $5.14 a month for a typical residential customer ($10.37 on CARE). That leaves typical PG&E bills about $25 a month lower than January 2024 — real movement, and the direction nobody expected two years ago. It also still leaves PG&E customers paying more than double the national average.
SCE, for its part, publishes a system average residential rate of 34.4¢/kWh effective June 1, 2026 (about 33.2¢ after the Climate Credit) — a tenth of a cent lower than the prior period. Flat is the new good news in SCE territory. Just don't confuse that 34–35¢ average with the peak: on SCE's standard TOU-D-4-9PM plan, the summer on-peak price is about 58¢/kWh from 4–9 p.m., and peak pricing across SCE's residential TOU plans generally runs high-40s to high-50s per kWh. The average is what the year works out to; the peak is what August costs.
The 2026 change most homeowners didn't see coming
Between October 2025 and March 2026, all three investor-owned utilities restructured residential bills around a Base Services Charge — the income-graduated fixed charge the CPUC authorized in 2024.
| Utility | Effective | Standard residential | CARE | FERA |
|---|---|---|---|---|
| SDG&E | October 2025 | ~$24/month | ~$6 | ~$12 |
| SCE | November 2025 | ~$24/month | ~$6 | ~$12 |
| PG&E | March 2026 | ~$24/month | ~$6 | ~$12 |
Each utility cut per-kWh delivery pricing by roughly 10% (SDG&E quantified it at about 5¢/kWh) to offset the new line item. The CPUC's stated goal was to make electrification — heat pumps, induction, EVs — cheaper per kilowatt-hour.
Whether it helped or hurt you is arithmetic, not opinion:
- Low-usage households generally pay more. A 250 kWh/month apartment doesn't consume enough kilowatt-hours for a 10% volumetric cut to recover $24.
- High-usage households generally pay less. A 1,200 kWh/month home with AC and an EV saves more on the volumetric cut than the fixed charge costs.
- Solar households feel it most. The Base Services Charge is not offset by production. If your solar array zeroed out your usage, you still owe roughly $24 a month plus taxes and fees. This is worth saying plainly, because a lot of solar marketing implies a $0 bill and that is no longer possible on an IOU.
If your bill jumped and you can't find the reason, why is my electric bill so high walks through the line items, and why did my SCE rates go up covers the SCE-specific history.
Why California rates got here
| Cost driver | What it does to your bill |
|---|---|
| Wildfire mitigation | Undergrounding, vegetation management, weather stations, insurance and liability reserves — the largest single driver of IOU rate increases since 2018 |
| Transmission and distribution | An aging grid serving vast, difficult terrain, with capital costs earning an authorized return |
| Public purpose programs | CARE/FERA discounts, energy efficiency, and low-income programs funded through rates rather than taxes |
| Generation | The commodity itself — and the one slice a community choice aggregator can compete on |
| Declining sales | Efficiency and rooftop solar reduce billed kilowatt-hours while fixed costs stay fixed, pushing up the per-kWh price for everyone remaining |
That last row is the uncomfortable one, and it's also why the Base Services Charge exists.
How much does the average California family spend on utilities — water, garbage, and electric combined?
Roughly $290–$310 a month as of mid-2026, for the three bills most households pay separately: about $170 for electricity, about $81 for water, and roughly $40–$60 for garbage collection depending on the city. Add natural gas — most California homes have it — and the combined figure lands closer to $330–$375 a month.
Here's the component math, each figure dated:
| Utility | Typical California monthly cost | Basis |
|---|---|---|
| Electricity | ~$170 | ~503 kWh at ~33.25¢/kWh (EIA data, mid-2026); EIA's 2024 full-year actual was $160.86 |
| Water | ~$81 | Statewide average, 2026 analyses of Statista data |
| Garbage / trash | ~$40–$60 | Current city rates: Riverside $37.32, San Diego $43.60 (new fee, July 2026), Pasadena $46.61, San Jose $53.45, Los Angeles $59.53 (January 2026) |
| Water + garbage + electric | ~$290–$310 | — |
| Natural gas (if applicable) | roughly $40–$65 averaged over the year | CA residential gas averaged $19.62 per thousand cubic feet for the 12 months ended February 2025 — about 40% above the US average; winter-heavy |
| All four combined | ~$330–$375 | — |
A few honest caveats. Water varies more than any other utility — a coastal household on a small lot can pay $50 while an inland family irrigating through a Central Valley summer pays $150+. Garbage is set city by city and has quietly become a real line item: Los Angeles raised its solid-waste fee to $59.53 in January 2026, and San Diego began charging single-family homes $43.60 a month in July 2026 for collection that used to be free. And many households pay some of this indirectly — bundled into rent or HOA dues — so "what families pay" and "what the service costs" aren't always the same number.
For a national yardstick: doxo's payment-data analysis (actual consumer payments, March 2024–March 2025) puts the median US household's combined utility spend — electric, gas, water and sewer, waste — at $347 a month. Its all-in totals for big California metros, which also fold in internet and phone, run $469 a month in San Diego, $545 in San Francisco, and $579 in San Jose. Either way, California families sit well above the national norm — and electricity is the largest slice, which is why it's the one worth attacking first.
What solar actually removes from a California bill
Under the CPUC's Net Billing Tariff — NEM 3.0 — power you export to the grid earns a low avoided-cost credit, typically single-digit cents for most hours. Power you use yourself instead of buying is worth full retail. That asymmetry is the entire design problem.
| Where a solar kWh goes | Value in SCE territory | Value in SDG&E territory |
|---|---|---|
| Consumed in your home | ~35¢ | ~46¢ |
| Stored, then used during the 4–9 PM peak | Up to ~58¢ | Up to ~60¢+ |
| Exported to the grid | Roughly 5–8¢ most hours | Roughly 5–8¢ most hours |
Which is why nearly every system we design in IOU territory pairs panels with a battery: bank the midday surplus, spend it during the expensive evening window, export as little as possible. In LADWP territory — where net metering is still close to retail — solar-only often still pencils, and we say so.
What solar does not remove: the Base Services Charge, taxes, and fees. Budget for roughly $25–$35 a month in non-bypassable charges even on a system that covers all your usage.
On the financing, since every quote in 2026 gets this wrong somewhere: the 30% federal residential clean-energy credit expired December 31, 2025 and does not apply to any 2026 installation. Anyone quoting you a 30% residential ITC this year is reading last year's script. What still exists is the federal commercial clean-energy credit, claimed by whoever owns the system. Through a prepaid solar lease — our Propel program through Concert Finance, or Participate Energy's prepaid lease — the financing partner captures that commercial credit and passes roughly 30% through as money off your cost up front.
You take title to the system at the start of year 6, essentially for free. It's a financing structure, not a tax filing, and we're not tax advisors — we put it in writing and suggest you confirm it with yours.
You can model your own numbers against your actual utility and usage with our savings designer, or see current installed pricing on the California solar panel cost page.
What's coming next
Rates are not standing still. Each of the big three has approved or pending changes for the rest of 2026 and into 2027:
- SCE rate changes in 2026 — June 1 nudged the average down to 34.4¢
- SDG&E rate changes in 2026 — April took the bundled average to 46.4¢
- LADWP rate changes in 2026
And if you're weighing an installer, our ranking of the best solar companies in California covers who's still standing after a brutal two years of industry bankruptcies.
One more number worth knowing, because it is the one regulators quote. The CPUC's Public Advocates Office measures each utility's system-average residential rate — total residential revenue divided by kilowatt-hours sold, which blends CARE discounts and baseline tiers into one figure. Its Q2 2026 Electric Rates Report (July 2026) puts that average, as of June 2026, at 33.7¢/kWh for PG&E, 34.4¢ for SCE, and 45.5¢ for SDG&E, and tracks the ten-year climb since January 2016 at 69%, 101%, and 97% respectively. Those averages sit below the per-kWh prices in the tables above because the tables show what a standard, non-CARE household pays on its marginal kilowatt-hours — the number that decides whether solar pencils. The report's own forecast caveat is the part to remember: forecasted rates "will likely increase as future revenue change requests are filed."
For the fixed charge itself — what it is, the $24.15 / $6 / $12.08 tiers, and why a solar bill no longer reaches $0 — see California's new electric fixed charge: what solar owners still pay.
Frequently asked questions
What is the average electric bill in California in 2026?
About $170 a month for a typical household using roughly 503 kWh at the statewide average residential rate of about 33.25¢/kWh. EIA's most recent full-year actual (2024) was $160.86. That average is dragged down by low household consumption and by municipal utilities, so investor-owned utility customers routinely pay far more — a 1,000 kWh SDG&E home is closer to $460.
How many kWh per day does a California home use?
About 16.5 kWh per day — 503 kWh a month per EIA's 2024 data, against a US average of roughly 28 kWh a day. Coastal homes with no air conditioning can run under 10 kWh a day; inland homes cooling through a heat wave can hit 33–50 kWh a day in July and August.
Why is electricity so expensive in California?
Mostly delivery costs, not generation. Wildfire mitigation and liability, transmission and distribution investment earning an authorized return, and public-purpose programs funded through rates rather than taxes. Falling billed kilowatt-hours — from efficiency and rooftop solar — spread those fixed costs over fewer units, which pushes the per-kWh price up further.
Why is my California electric bill so high?
Start with three suspects: the rate window (on SCE's standard TOU plan, 4–9 p.m. usage costs up to ~58¢/kWh), the ~$24 Base Services Charge that appeared on IOU bills between October 2025 and March 2026, and seasonal usage creep. Our why is my electric bill so high guide walks the line items one by one.
Which California utility has the highest electricity rates?
SDG&E, at about 46.4¢/kWh as of April 2026 — the highest of any major utility in the continental United States. PG&E follows at roughly 40–41¢ after its March 2026 decrease, then SCE at 34–35¢. LADWP, as a municipal utility, runs an effective 26–31¢.
Is the average electric bill higher in San Diego or Los Angeles?
San Diego, by a wide margin. SDG&E's bundled average is about 46.4¢/kWh, versus roughly 34–35¢ in SCE-served LA suburbs and an effective 26–31¢ inside LA city limits on LADWP. At 500 kWh a month that's roughly $230 in San Diego against $140–$175 in Los Angeles. The full breakdown is in our average electric bill in San Diego guide.
How much does the average California family spend on utilities — water, garbage, and electric combined?
Roughly $290–$310 a month as of mid-2026: about $170 for electricity, about $81 for water, and roughly $40–$60 for garbage depending on the city. Homes with natural gas land closer to $330–$375 all-in.
What is the Base Services Charge and why is it on my bill?
It's the income-graduated fixed charge the CPUC authorized in 2024, phased in by SDG&E in October 2025, SCE in November 2025, and PG&E in March 2026. Standard residential customers pay about $24 a month, CARE about $6, FERA about $12, and per-kWh delivery pricing dropped roughly 10% to offset it. Low-usage homes tend to pay more overall; high-usage homes tend to pay less.
How much electricity does the average California home use?
About 503 kWh per month — roughly 16.5 kWh a day, and well below the US average of about 863 kWh a month. Mild coastal climate, widespread gas heating, and decades of appliance efficiency standards account for most of the gap. Inland and desert homes with summer air conditioning routinely run 1,000–1,500 kWh in July and August.
Can solar eliminate my California electric bill entirely?
It can eliminate the usage portion, but not the whole bill. The Base Services Charge, taxes, and other non-bypassable charges survive regardless of production — budget roughly $25–$35 a month. Under NEM 3.0, systems that pair solar with a battery and maximize self-consumption get much closer to zero than export-heavy designs do.
Last verified: August 2026 by Helios Energy Global.
Sources
- EIA – Electric Power Monthly, average retail price by state
- EIA – 2024 Average Monthly Bill, Residential (Table 5A)
- EIA – California State Energy Profile
- PG&E – Electric rates decreasing January 1, 2026 (rate advisory)
- PG&E – Lowers electric prices in March 2026, fifth decrease since early 2024
- PG&E – Base Services Charge
- SCE – Rate advisory (average residential rate, June 2026)
- SCE – Base Services Charge
- SDG&E – Bundled electric rate change alert, April 2026
- SDG&E – Electric billing and the Base Services Charge
- LADWP – Residential electric rates
- CPUC – Net Billing Tariff (NEM 3.0)
- CPUC – California Climate Credit
- Choose Energy – Electricity rates by state, August 2026 report
- Solar.com – SCE time-of-use rates, 2026
- doxo – What Americans really pay for utilities (2024–2025 payment data)
- LawnStarter – Average water bill by state (2026)
- Dropcurb – Average garbage bill by city (2026)
- Public Advocates Office (CPUC) — Q2 2026 Electric Rates Report — July 2026
- SCE — Base Services Charge (income-graduated fixed charge) — August 2026
More guides
Sunnova Bankruptcy: Who Services Sunnova Solar Systems in California Now?
Sunnova filed Chapter 11 in June 2025; its assets were sold to Solaris Assets LLC and SunStrong Management now services most former Sunnova lease, PPA, and battery accounts in California.
ReadHow much does a 12 kW solar system cost in California in 2026?
A 12 kW solar system in California runs roughly $30,000–$42,000 installed before incentives, making it one of the most common sizes for homes with an EV, pool, and central AC.
ReadCan you really get free solar panels from the government in 2026?
No — the government does not give away free solar panels in 2026; the federal tax credit expired Dec 31, 2025, and 'free solar' pitches are almost always $0-down leases with 20-25 year contracts.
ReadGet a free consultation and custom design.
No pressure, no obligation — the owner reviews every design we send.