What is the average SCE bill in 2026?
The average SCE residential bill in 2026 runs roughly $170–$350/month depending on usage, driven by rates of approximately 34–35¢/kWh.
By Taylor Crouse — Founder, Helios Energy GlobalUpdated
Quick answer
- SCE residential rates average roughly 34–35¢/kWh in 2026, putting typical bills at $170–$350/month depending on usage.
- A 750 kWh/month household pays about $265–$278/month — roughly $3,200/year.
- LADWP's average rate is approximately 28¢/kWh, about roughly 15–20% lower than SCE's.
- SCE's on-peak window is 4–9 PM daily, and NEM 3.0 export credits are only about 5–8¢/kWh.
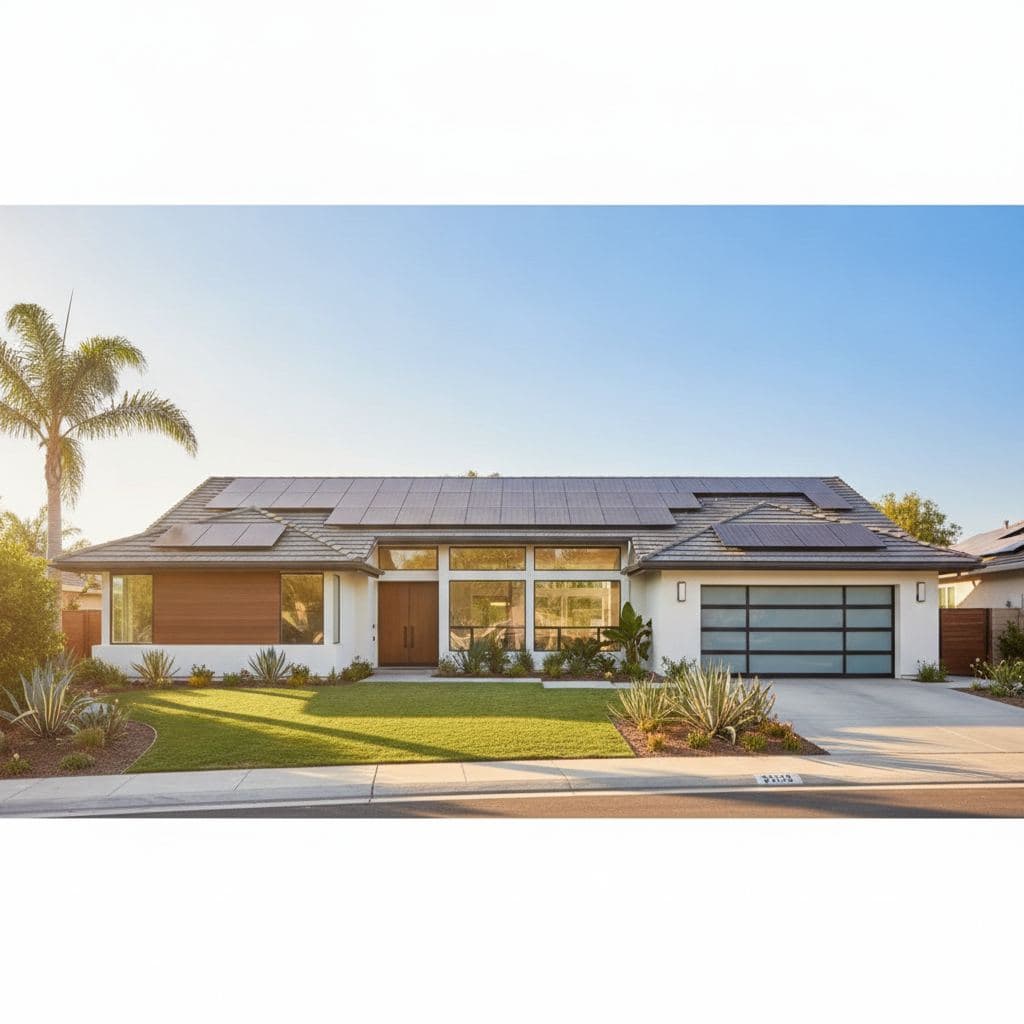
SCE residential customers pay an average of roughly 34–35¢ per kilowatt-hour in 2026, which works out to approximately $170–$350 per month for a typical Southern California home depending on how much electricity you use. A household consuming 750 kWh per month — close to the regional median — lands around $255–$265 before taxes and fixed delivery charges.
Last verified: September 2026 by Helios Energy Global.
Those numbers sting compared to even five years ago, and they're a big reason homeowners across the SCE service territory — from Santa Monica to Riverside — are running the numbers on solar. Here's what's actually driving your bill and what you can realistically do about it.
What you're actually paying: usage vs. bill
SCE's residential rates aren't a single flat number. The utility uses Time-of-Use (TOU) pricing, which means the rate you pay depends on when you use electricity, not just how much. The critical window is 4–9 PM, when on-peak rates kick in and can run meaningfully higher than the blended average.
The table below uses the approximate 2026 blended average rate of 34–35¢/kWh to show estimated monthly bills at three common usage levels. Actual bills will vary based on your specific TOU plan, baseline territory, fixed charges, and whether you have an EV or pool.
| Monthly Usage | Blended Rate (est.) | Energy Charge (est.) | Fixed Charges (est.) | Total Bill (est.) |
|---|---|---|---|---|
| 500 kWh | ~34–35¢/kWh | ~$170–$175 | ~$10–$15 | ~$180–$190 |
| 750 kWh | ~34–35¢/kWh | ~$255–$263 | ~$10–$15 | ~$265–$278 |
| 1,000 kWh | ~34–35¢/kWh | ~$340–$350 | ~$10–$15 | ~$350–$365 |
All figures are estimates based on 2026 SCE rate filings. Fixed charges include basic service and delivery components. Taxes and surcharges add a small additional amount.
Why SCE rates are so high — and still climbing
SCE rates have risen sharply over the past several years, driven by a combination of wildfire mitigation infrastructure, grid hardening, and general utility capital investment that gets passed through to ratepayers via CPUC-approved rate cases. EIA data consistently ranks California among the highest-cost states for residential electricity, and SCE sits above the California average.
A few structural factors make the 2026 rate environment particularly challenging:
- Wildfire cost recovery: Billions in grid hardening costs are amortized into rates over time.
- TOU rate design: The 4–9 PM peak window means households with evening routines — cooking dinner, charging an EV, running the dishwasher — face the highest rates precisely when they're most active.
- Baseline tiers: SCE's baseline allowance system means usage above your "baseline" moves into higher tiers, compounding the effective rate for moderate-to-heavy users.
- Ongoing rate cases: SCE has filed for additional rate increases; CPUC proceedings are ongoing, meaning the 34–35¢ average could edge higher before the year is out.
SCE vs. LADWP: a tale of two utilities
If you're comparing notes with a neighbor who has LADWP service, their bill almost certainly looks very different — and that's not because they're using less electricity.
LADWP (the Los Angeles Department of Water and Power) is a municipal utility that sets its own rates independently of the CPUC. In 2026, LADWP's average residential rate runs approximately 28¢/kWh — roughly roughly 15–20% lower than SCE's blended average. LADWP also still offers retail-rate net metering, meaning solar owners get credited at the full retail rate for power they export to the grid.
SCE, as an investor-owned utility (IOU), falls under the CPUC's NEM 3.0 / Net Billing Tariff. Under NEM 3.0, export credits are set at a much lower "avoided cost" rate — often just 5–8¢/kWh — rather than the retail rate. This fundamentally changes the solar math for SCE customers: exporting excess solar during the day earns you very little, which is why pairing solar with a battery has become far more compelling in SCE territory.
Other municipal utilities in Southern California — Pasadena Water and Power, Burbank Water and Power, Glendale Water and Power, Anaheim Public Utilities, and Riverside Public Utilities — also run their own net metering programs and are not subject to NEM 3.0. If you're in one of those service territories, your solar economics look meaningfully different than your SCE-territory neighbors.
See our NEM 3.0 explainer for a full breakdown of how the tariff works and what it means for payback periods.
What a 750 kWh/month SCE bill means for solar
A household spending roughly $265–$278/month on electricity — about $3,200/year — has a compelling case for solar, even under NEM 3.0. Here's the rough math:
A system sized to offset 750 kWh/month in Southern California typically needs 5–7 kW of panels, depending on roof orientation, shading, and local sun hours (the Santa Monica / greater LA area averages around 5.5–6 peak sun hours per day).
At $2.50–$3.50 per watt installed (the approximate 2026 range before any incentives), that system costs roughly $12,000–$22,750 before incentives. Important note for 2026 buyers: the 30% federal residential solar Investment Tax Credit expired December 31, 2025. There is no federal tax credit available for a residential solar system installed in 2026. Your incentive picture now depends on California-specific programs and any local utility rebates — which vary significantly by territory.
Because NEM 3.0 export credits are low, the financial case for SCE customers increasingly rests on self-consumption — using the solar power you generate directly, rather than exporting it. That's why pairing a solar array with a home battery has become the standard recommendation in SCE territory. A battery lets you store afternoon solar production and deploy it during the expensive 4–9 PM peak window, effectively replacing grid power at 34–35¢/kWh with stored solar power at near-zero marginal cost.
Home batteries in 2026 run approximately $14,000–$18,500 installed per unit. The California SGIP (Self-Generation Incentive Program) residential battery rebate program is currently waitlisted — budget rounds are oversubscribed — so plan on paying full price and check back as new budget cycles open.
Explore how solar and battery storage interact under NEM 3.0 in our solar vs. battery NEM 3.0 guide, or get a personalized design and savings estimate based on your actual SCE bills.
Practical ways to reduce your SCE bill right now
Even before you go solar, there are rate-structure moves that can reduce what you pay:
- Shift loads out of the 4–9 PM window: Run your dishwasher, laundry, and EV charger overnight or before 4 PM. This alone can meaningfully reduce your effective rate.
- Enroll in the right TOU plan: SCE offers multiple TOU variants. Depending on your usage pattern, switching plans can lower your bill without changing your behavior at all.
- Audit your baseline territory: SCE's baseline allowance varies by climate zone. Confirming you're in the right zone is a quick check that occasionally surfaces billing errors.
- Consider a home battery even without solar: In some cases, a battery charged on cheap overnight rates and discharged during peak hours pencils out — though the economics depend heavily on your usage profile.
For the statewide picture — how this compares against PG&E, SCE, SDG&E and LADWP, and what the new Base Services Charge changed in 2026 — see what the average electric bill in California actually is.
Frequently asked questions about average SCE bills
What is the average SCE electric bill per month in 2026?
For a typical Southern California household using around 700–800 kWh per month, the average SCE bill in 2026 runs approximately $240–$290/month based on a blended rate of roughly 34–35¢/kWh. Fixed delivery and service charges add another $10–$15 on top of the energy charge. Your actual bill depends on your TOU plan, baseline territory, and when you use power.
Why is my SCE bill so high compared to my neighbor's?
If your neighbor is on LADWP service, their rates are approximately 28¢/kWh — about roughly 15–20% lower than SCE's. Even within SCE territory, bills vary based on TOU plan, usage timing, and whether you have high-draw appliances like a pool pump or EV. Heavy usage during the 4–9 PM on-peak window is the single most common driver of unexpectedly high SCE bills.
Does SCE charge more during peak hours in 2026?
Yes. SCE's standard residential TOU plans designate 4–9 PM every day as the on-peak period, when rates are significantly higher than the off-peak rate. The blended 34–35¢/kWh average masks this spread — your actual on-peak rate is higher, and your off-peak rate is lower. Shifting discretionary loads outside that window is the fastest free way to cut your bill.
Will SCE rates go up more in 2026 and 2027?
SCE has pending rate cases before the CPUC, and the general trajectory of California IOU rates has been upward for several consecutive years. While specific approved increases aren't finalized here, planning for rates to remain at or above current levels — and potentially higher — is the more conservative assumption for solar payback calculations.
Is solar still worth it for SCE customers after NEM 3.0?
Yes, but the math works differently than it did under NEM 2.0. Because NEM 3.0 pays low export credits, the value of solar comes primarily from self-consumption — using what you generate directly. Pairing solar with a battery to capture afternoon production and use it during the 4–9 PM peak is now the standard approach in SCE territory. Payback periods are longer than the NEM 2.0 era, but at 34–35¢/kWh, avoided-cost savings are still substantial. See our solar panel cost page for current pricing context.
How does SCE compare to LADWP for solar customers?
LADWP customers get retail-rate net metering (approximately 28¢/kWh credit for exports) and a lower base rate to begin with. SCE customers face NEM 3.0 export credits of roughly 5–8¢/kWh and higher base rates. Ironically, the higher SCE rates make the avoided-cost value of self-consumed solar greater — but the lower export value means battery storage is nearly essential to maximize that value. Our locations page covers service territory details across Southern California.
What size solar system do I need to eliminate my SCE bill?
For a 750 kWh/month household, a system in the 5–7 kW range typically covers most of the load, assuming good roof orientation and minimal shading. But under NEM 3.0, "eliminating" your bill means maximizing self-consumption, not maximizing export — so system sizing strategy has changed. A custom design based on your actual 12-month SCE usage history gives you a far more accurate picture than any rule of thumb.
Next steps
- Book a free consultation and custom design — we'll pull your actual SCE usage data and show you real numbers, not averages.
- See what a solar system costs in 2026 — current installed price ranges for Southern California.
- Explore home battery storage — why pairing storage with solar matters more than ever under NEM 3.0.
- Understand NEM 3.0 in plain English — how SCE's export credit structure works and what it means for your payback.
- Compare solar vs. battery strategy under NEM 3.0 — self-consumption math explained.
- View our Southern California service areas — SCE, LADWP, and municipal utility territories we serve.
More guides
Buying a House With Solar in California (2026): What Happens to the NEM Agreement?
Good news first: the seller's net metering agreement transfers with the home — the AB 942 provision that would have ended it at sale was defeated. Here's the due-diligence checklist that actually matters: owned vs. leased, the PTO date, system health, and roof condition.
ReadSolar Panel Removal and Reinstallation in Riverside County: What It Costs in 2026
Helios charges $250–$350 per panel for a detach-and-reset in Riverside County — about $3,750–$8,750 for a typical 15–25 panel system, with tile roofs, which dominate the Inland Empire housing stock, at the top of the range.
ReadCharging an EV with Solar Panels in 2026: How Much Panel Do You Actually Need?
Most Southern California homeowners need 2–4 extra kilowatts of solar to cover EV charging — here's how to size it right for SCE or LADWP.
ReadGet a free consultation and custom design.
No pressure, no obligation — the owner reviews every design we send.