What's the Average Electric Bill in Palm Springs? (2026)
Palm Springs households average around $300/month on SCE — and summer bills for a typical home can top $470, while larger homes with pools push past $1,000. A mile east, IID customers pay a fraction of the rate. Here's the two-utility story and what it means for solar.
Published
Quick answer
- Palm Springs households on SCE average roughly $300 per month across the year — about 60%+ above the national average. > - Summer bills for a typical ~1,800 sq ft home commonly hit $450–$500; larger homes with pools regularly pass $1,000 in July and August.
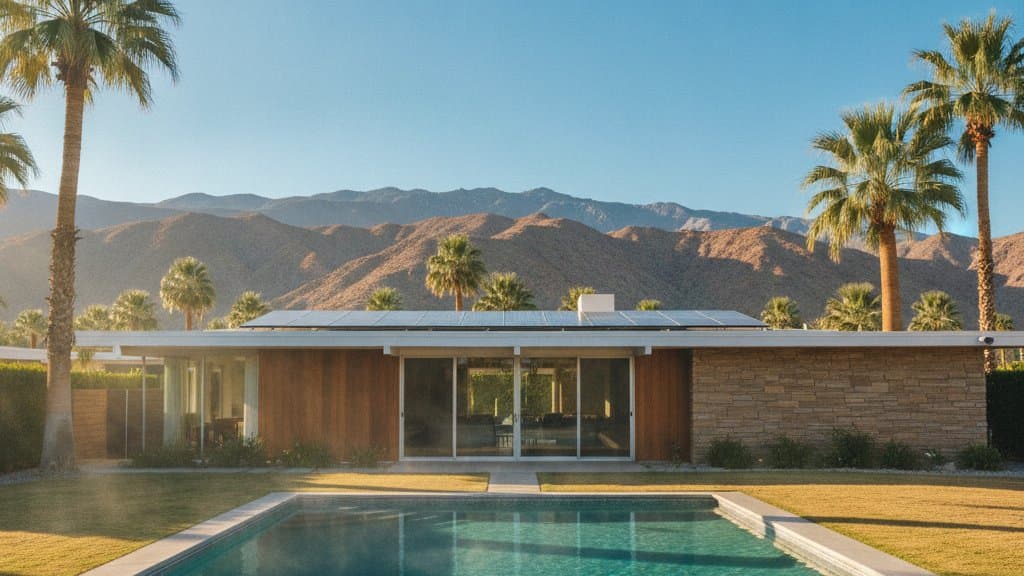
- SCE's average residential rate is about 34–35¢/kWh; IID's energy rate next door runs in the low teens — neighbors a few miles apart pay wildly different bills. > - Summer usage in the desert routinely runs 2–3x winter usage, driven almost entirely by air conditioning.
Ask "what's the average electric bill in Palm Springs?" and the honest first answer is a question back: which side of the utility line are you on? Palm Springs proper is Southern California Edison territory. But the Coachella Valley splits between SCE and the Imperial Irrigation District — roughly, Palm Springs, Desert Hot Springs, and parts of Cathedral City and Rancho Mirage sit on SCE, while Indio, La Quinta, Coachella, Indian Wells, Palm Desert, and the east valley are largely IID.
Two houses a couple of miles apart, same 115°F afternoon, same AC runtime — and the SCE house can pay double or more for the identical kilowatt-hours. It's the single most consequential fact about desert electric bills, and most rate guides skip it entirely.
Last verified: July 2026 by Helios Energy Global.
Summer is the whole story
Palm Springs logs on the order of 4,000+ cooling degree days a year per NOAA climate normals — several times what the SoCal coast sees. From May through October, daily highs of 105–120°F mean air conditioning runs 10–18 hours a day and accounts for 50–75% of a home's total electricity use. That's not waste; that's physics. The result is a bill curve that looks nothing like coastal California:
| Home type (SCE territory) | Typical summer bill (Jul–Aug) | Typical winter bill (Dec–Feb) |
|---|---|---|
| Condo / small home, under 1,500 sq ft | $250–$400 | $90–$160 |
| ~1,800–2,500 sq ft home | $450–$700 | $140–$250 |
| 3,000+ sq ft, pool + heavy AC | $800–$1,500+ | $250–$450 |
Those are estimates built from SCE's published rates, EnergySage's Palm Springs cost data, and EIA benchmarks — individual homes vary a lot with insulation, thermostat habits, and pool equipment. The year-round Palm Springs average works out to roughly $300 a month, but averages flatten the real experience: a $150 January and a $600 July.
The SCE vs. IID divide
| SCE (west valley) | IID (east valley) | |
|---|---|---|
| Average residential rate | ~34–35¢/kWh | Energy rate in the low teens (¢/kWh), even after recent multi-year rate adjustments |
| Structure | Time-of-use plans; summer peak power can price into the high 40s–high 50s (¢/kWh) 4–9 PM | Simpler tiered/TOU structure, no CPUC oversight |
| Why the difference | Investor-owned; wildfire, transmission, and delivery costs plus an authorized return on equity | Publicly owned, nonprofit, low-cost hydro and local generation |
| Solar rules | NEM 3 net billing | IID's own net billing program, exports credited at a set rate |
The practical upshot: an east-valley home in Indio can run the same summer AC load as a Palm Springs home and pay less than half as much. If you're comparing bills with a friend across the valley, you're not imagining it — we've written up the full IID rate picture separately.
What this means for solar in the desert
The desert is a strange and wonderful solar market: the sun is relentless, usage is enormous, and the economics split cleanly along the utility line.
| SCE customer | IID customer | |
|---|---|---|
| Value of self-consumed solar kWh | ~34–35¢, up to ~50¢+ at summer peak | Low teens (¢/kWh) |
| Export credit | Avoided-cost rate, ~5–8¢ most hours | Set credit rate (single digits ¢/kWh) |
| Battery case | Strong — shift midday solar into the 4–9 PM peak | Weaker for savings; mainly outage protection |
| Typical payback | Among the fastest in SCE territory, because summer usage is so high | Meaningfully longer — cheap grid power is hard to beat |
For Palm Springs homes on SCE, solar sized to the summer AC load — usually with a battery to carry the 4–9 PM peak — attacks exactly the bills that hurt. One honest note we lead with in 2026: the 30% federal residential solar tax credit expired December 31, 2025, so none of this math assumes it.
For high-usage SCE desert homes the unsubsidized numbers still pencil clearly; for IID homes we'll tell you straight when they don't. Desert roofs also have their own engineering realities — panel temperature derating, dust, and monsoon wind loads — which is why we design from your actual 12 months of usage rather than a postcard estimate.
For the statewide picture — how this compares against PG&E, SCE, SDG&E and LADWP, and what the new Base Services Charge changed in 2026 — see what the average electric bill in California actually is.
Frequently asked questions
What is the average electric bill in Palm Springs?
Around $300 per month averaged across the year for a typical SCE household — but the seasonal swing is extreme. Winter bills for a modest home often sit under $200 while July and August bills for the same home run $450–$700, and large homes with pools can exceed $1,000–$1,500 in peak summer.
Why is my Palm Springs electric bill so high in summer?
Air conditioning, almost entirely. With daily highs of 105–120°F, AC runs 10–18 hours a day and accounts for 50–75% of summer usage — and on SCE time-of-use plans, the 4–9 PM hours when the house is hottest are also the most expensive hours of the day.
Why does my neighbor in Indio or La Quinta pay so much less than I do?
They're almost certainly on Imperial Irrigation District, the publicly owned utility serving most of the east Coachella Valley. IID's energy rates run in the low teens of cents per kWh versus SCE's roughly 34–35¢ average, so identical usage produces a dramatically smaller bill on the IID side of the line.
Is solar worth it in Palm Springs?
On SCE, usually yes — enormous summer usage at 34¢+ per kWh is exactly the load solar and batteries offset best, and desert sun means excellent production. On IID, the math is tighter because grid power is cheap; solar can still make sense for high-usage homes and outage resilience, but we'd run your actual numbers before recommending it.
How many kWh does a Palm Springs home use per month?
Expect roughly 600–900 kWh in winter months and 1,500–2,500+ kWh in peak summer for a typical single-family home — well above the California average of about 503 kWh/month (EIA, 2024). Pools, older AC systems, and poor insulation push totals higher; see our Southern California usage benchmarks for detail.
More guides
Best Solar Companies in Palos Verdes Estates, CA (2026): Honest Rankings for a Coastal Clifftop Community
A straight-talking, numbers-first guide to the best solar installers in Palos Verdes Estates — covering SCE's Net Billing Tariff, HOA design review, coastal efficiency gains, and what a real 2026 quote should look like.
ReadDo ADUs Need Solar Panels in California? Title 24 Rules, Sizing and Exceptions (2026)
Newly built detached ADUs generally require a solar PV system sized by Equation 150.1-C under California's 2025 Energy Code — typically 1.8–4 kW for most Southern California backyard units — while garage conversions, attached additions, and JADUs are exempt.
ReadTesla Powerwall 3 Expansion Pack: capacity, limits, and what it adds (2026)
A Tesla Powerwall 3 Expansion adds 13.5 kWh of storage and zero extra inverter power, with a hard limit of 3 Expansion units per system, all wired to the leader Powerwall 3.
ReadGet a free consultation and custom design.
No pressure, no obligation — the owner reviews every design we send.