Why did my SCE rates go up? (And how much more are they projected to rise?)
SCE's average residential rate has climbed roughly 80% since 2018 — from about 18–19¢/kWh to ~34.5¢/kWh in 2026 — with CPUC-approved increases already locked in through 2028.
By Taylor Crouse — Founder, Helios Energy GlobalUpdated
Quick answer
- SCE's average residential rate climbed roughly 80% in eight years — from about 18–19¢/kWh in 2018 to approximately 34.5¢/kWh in January 2026.
- The 2025 General Rate Case authorized a +9.1% increase in 2025, plus roughly +2.6–2.7% per year through 2028 — already approved, not proposed.
- Wildfire mitigation and grid hardening are the biggest cost drivers, with annual increases capped at 5% by a CPI mechanism.
- A 500 kWh/month bill has grown from about $93 in 2018 to about $173 in 2026.
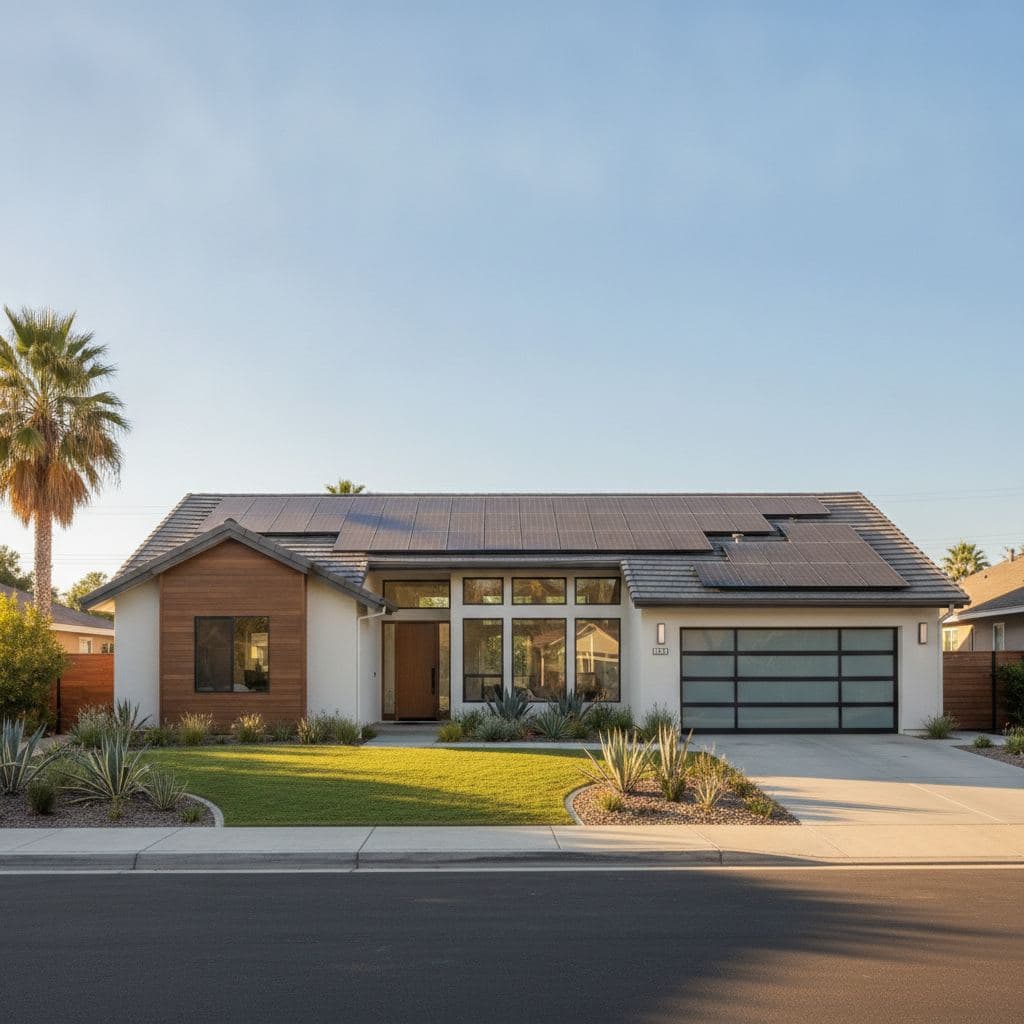
SCE's average residential rate has risen from roughly 18–19¢/kWh in 2018 to approximately 34.5¢/kWh in January 2026 — nearly double in eight years. The primary drivers are wildfire mitigation, grid hardening, and transmission infrastructure spending, all reviewed and approved by the California Public Utilities Commission (CPUC) through a process called a General Rate Case (GRC).
Last verified: September 2026 by Helios Energy Global.
The numbers at a glance
| Year | Approx. SCE avg. residential rate | Est. monthly bill at 500 kWh/mo | Notes |
|---|---|---|---|
| 2018 | ~18–19¢/kWh | ~$93/mo | Pre-wildfire-era baseline |
| 2022 | ~24–26¢/kWh | ~$120–130/mo | Estimate; mid-cycle increases |
| Jan 2025 | ~31.6¢/kWh | ~$158/mo | Post-2025 GRC decision effective |
| Oct 2025 | ~35.3¢/kWh | ~$177/mo | Peak after October 2025 adjustment |
| Jan 2026 | ~34.5¢/kWh | ~$173/mo | Current anchor rate |
| 2027 (projected) | ~35.4¢/kWh (est.) | ~$177/mo (est.) | CPUC-authorized +~$5.11/mo (+2.6%) |
| 2028 (projected) | ~36.3¢/kWh (est.) | ~$185+/mo (est.) | CPUC-authorized +~$5.26/mo (+2.7%) |
All figures are approximate. "Projected" rows are based on CPUC-authorized increases from the 2025 GRC decision and are subject to change. Actual bills vary by usage, rate plan, and TOU period.

What is actually driving SCE's rate increases?
SCE doesn't raise rates on a whim. Every significant increase goes through a CPUC General Rate Case — a formal, multi-year regulatory proceeding where SCE files a request, intervenors challenge it, and the CPUC issues a binding decision. The 2025 GRC decision authorized a +9.1% increase for a typical 500 kWh/month customer in 2025, followed by smaller authorized increases of approximately $5.14/month (+2.7%) in 2026, $5.11/month (+2.6%) in 2027, and $5.26/month (+2.7%) in 2028, each capped at 5% per year by a CPI mechanism.
Here's where the money actually goes:
Wildfire mitigation and liability insurance
California's wildfire risk has fundamentally changed what it costs to run a utility. SCE is required to submit and execute a Wildfire Mitigation Plan approved by the CPUC. This covers:
- Covered conductor programs — replacing bare overhead lines with insulated wire across high-risk zones
- Enhanced Powerline Safety Settings (EPSS) — faster fault detection that trips circuits before ignition
- Public Safety Power Shutoffs (PSPS) — the infrastructure to execute and communicate planned outages
- Insurance and self-insurance costs — wildfire liability exposure has made commercial insurance extraordinarily expensive for California IOUs
This is the single largest cost category driving recent increases and the one that is hardest to reverse.
Grid hardening and infrastructure replacement
Much of Southern California's distribution infrastructure was built in the 1960s and 1970s and is reaching end-of-life. SCE's capital program includes:
- Replacing aging poles, transformers, and switching equipment
- Underground cabling in extreme high-fire-hazard severity zones (EHFHSZ)
- Smart meter and grid modernization upgrades
- Substation reliability investments
Capital investments are "rate-based" — meaning SCE earns a regulated return on them, and customers pay that return through rates over the asset's useful life. More capital spending means a higher rate base, which means higher bills.
Transmission spend
Regional transmission upgrades — many tied to California's clean energy mandates and the need to move renewable power from desert and mountain generation zones to coastal load centers — add another layer of cost. These are often approved through FERC processes rather than CPUC GRCs, but they still flow through to your bill.
What is NOT in your control: the rate trajectory
The CPUC has already authorized increases through 2028. These are not proposals — they are approved. Barring an extraordinary regulatory reversal (which is rare and slow), the direction of SCE rates is set. The 5% annual CPI cap provides some ceiling, but it still means compounding increases year over year.
SCE vs. LADWP: why your zip code matters enormously
If you live in Santa Monica, Culver City, Torrance, Pasadena (outside city limits), or most of the South Bay, you are an SCE customer and everything above applies to you.
If you live inside the City of Los Angeles, you are likely an LADWP customer — and the situation is meaningfully different. LADWP's average residential rate is approximately 28¢/kWh in 2026, and LADWP still offers retail-rate net metering (not NEM 3.0). That means solar exports are credited at the full retail rate, which makes the economics of solar significantly more favorable for LADWP customers than for SCE customers under NEM 3.0.
SCE customers are on NEM 3.0 (the CPUC Net Billing Tariff), which credits solar exports at a much lower avoided-cost rate — roughly 5–8¢/kWh during most hours, rising to a meaningful credit only during the 4–9 PM peak window. This is why battery storage is nearly essential for SCE solar customers: you generate during the day, store it, and discharge during the 4–9 PM peak when the export credit (and your avoided rate) is highest.
For a deeper breakdown of how NEM 3.0 changes the math, see our NEM 3.0 explained guide and solar vs. battery under NEM 3.0.
The one thing you can actually control
Here is the uncomfortable truth: SCE rate increases are approved years in advance, trend only one direction, and there is nothing an individual homeowner can do to change them. The CPUC process is public and participatory, but it operates on a multi-year cycle, and the 2025 GRC decision is done.
What you can control is how much power you buy from SCE at all.
Solar reduces your grid consumption
A properly sized solar system — typically 6–12 kW for a Southern California home, depending on usage and roof space — can offset 80–100% of your annual consumption. At ~$2.50–$3.50 per watt installed before incentives, a 8 kW system runs roughly $20,000–$28,000 before any applicable state or local incentives. Note: the 30% federal residential solar tax credit expired December 31, 2025 and is not available for 2026 purchases. Check with a tax professional about any state-level incentives that may apply to your situation.
Battery storage beats the 4–9 PM peak
SCE's TOU peak window — 4 to 9 PM — is when grid power is most expensive and when export credits under NEM 3.0 are at their highest. A home battery (roughly $14,000–$18,500 installed per unit) lets you:
- Store solar energy generated midday
- Discharge during the 4–9 PM peak, avoiding the highest-cost grid power
- Maximize NEM 3.0 export credits by timing any excess export to the peak window
- Provide backup power during PSPS outages, which are increasingly common in SCE territory
The math changes materially when you run it against a 34.5¢/kWh baseline that is projected to keep climbing. A system designed in 2026 locks in your cost of generation — your solar panels don't file a General Rate Case.
SGIP battery rebates: waitlisted in 2026
California's Self-Generation Incentive Program (SGIP) provided meaningful rebates for home batteries in prior years. As of 2026, residential SGIP budgets are waitlisted — meaning new applicants are queued, not immediately funded. We track this closely and will flag if allocations open. See our battery storage page for current details.
What an 80% rate increase actually means for payback math
When SCE rates were 18–19¢/kWh, solar payback periods in SCE territory were often 9–12 years. At 34.5¢/kWh — with authorized increases through 2028 already baked in — the value of each kilowatt-hour you generate yourself is nearly double what it was eight years ago. Payback periods for well-designed systems in SCE territory have compressed significantly, even accounting for NEM 3.0's lower export credits.
The design and savings estimator on our site runs your specific address, usage, and utility against current SCE rate schedules to give you a realistic projection — not a marketing number.
Frequently asked questions about SCE rate increases
Why does SCE keep raising rates every year?
SCE raises rates primarily to fund wildfire mitigation, grid hardening, aging infrastructure replacement, and transmission upgrades — all of which the CPUC reviews and approves through a General Rate Case process. The 2025 GRC decision already authorized increases for 2026, 2027, and 2028, so near-term increases are not speculative; they are scheduled.
How much has SCE's rate gone up since 2018?
SCE's average residential rate was roughly 18–19¢/kWh in 2018. By January 2026 it was approximately 34.5¢/kWh — an increase of roughly 80% over eight years. For a household using 500 kWh/month, that translates to a monthly bill that has grown from about $93 to about $173.
Will SCE rates go down in the future?
It is unlikely in the near term. The cost drivers — wildfire liability, infrastructure replacement, and clean energy transmission — are structural and multi-decade. The CPUC's 2025 GRC decision authorized increases through 2028, and future GRC cycles will address costs beyond that. The 5% annual CPI cap limits the rate of increase but does not reverse it.
Does solar still make sense under NEM 3.0 for SCE customers?
Yes, but the design matters more than it used to. Under NEM 3.0, export credits are low during most daytime hours, so a solar-only system without storage has a longer payback than it did under NEM 2.0. Pairing solar with a battery — so you can discharge during the 4–9 PM peak and maximize the value of your generation — is the approach that makes the most financial sense for most SCE customers. See our solar vs. battery under NEM 3.0 guide for the full breakdown.
I'm an LADWP customer — do these SCE increases affect me?
No. LADWP is a municipal utility and sets its own rates independently of the CPUC and SCE. LADWP's average residential rate is approximately 28¢/kWh in 2026 — significantly lower than SCE's — and LADWP still offers retail-rate net metering, not NEM 3.0. The economics of solar are different (and in some ways more straightforward) for LADWP customers. Our locations page covers utility-by-utility details for Southern California.
Is there any rebate to help offset the cost of solar or batteries in 2026?
The 30% federal residential solar tax credit expired December 31, 2025 and is not available for systems installed in 2026. California's SGIP battery rebate program has residential budgets that are currently waitlisted. Some local utilities and municipalities offer their own incentives — we track these and will walk you through what applies to your address during a consultation. Visit our solar panel cost page for a current overview.
What size solar system do I need to offset my SCE bill?
It depends on your annual consumption, roof orientation, shading, and which SCE rate plan you're on. A typical Southern California home using 600–900 kWh/month might need a 7–12 kW system to cover most of its usage. The only way to get an accurate number is a site-specific design — which is exactly what we do for free. See our solar overview or book a consultation.
Next steps
- Book a free consultation and custom design — we'll pull your SCE usage data, model your roof, and show you exactly what a system would cost and save at today's rates.
- Run your design and savings estimate — see projected savings against current and projected SCE rates before you talk to anyone.
- Learn how NEM 3.0 works — understand the export credit structure that shapes every SCE solar decision in 2026.
- Solar + battery under NEM 3.0 — the case for pairing storage with solar in SCE territory, with numbers.
- Battery storage options — current installed cost ranges, SGIP waitlist status, and what to expect from a home battery in SCE territory.
- Solar panel cost in Southern California — per-watt pricing ranges, what affects your quote, and how to compare proposals.
More guides
Solar cost per square foot in California: how roof area maps to system size (2026)
California solar runs roughly $4–$7 per square foot of panel area, and a 6 kW system needs about 350–450 sq ft of roof — how roof area maps to price, and why installers quote per watt instead.
ReadWhat's the Average Electric Bill in San Diego? (2026)
San Diego households pay the highest electricity rates in the continental US — SDG&E's bundled residential average sits near 46¢/kWh in 2026. Here's what typical bills look like at real usage levels, what SDCP changes, and how the solar math works under NEM 3.
ReadHome Battery Backup Without Solar in California: When Does It Make Sense in 2026?
A standalone home battery in California costs $14,000–$18,500 installed and makes financial sense for SCE and SDG&E customers with a 30–45¢/kWh peak-to-off-peak spread—or for anyone in a High Fire Threat District facing PSPS outages.
ReadGet a free consultation and custom design.
No pressure, no obligation — the owner reviews every design we send.