How Much Power Does a Solar Panel Produce? Watts, kWh per Day and What a Southern California Roof Actually Makes (2026)
A 400–440 W residential panel produces roughly 1.7–1.9 kWh per day in Southern California — 620–680 kWh per year in Los Angeles, slightly more in the Inland Empire, and a bit less in coastal San Diego.
By Taylor Crouse — Founder, Helios Energy GlobalPublished
Quick answer
- Residential solar panels sold in 2026 are rated 400–475 W at nameplate (DC, Standard Test Conditions).
- One 400 W panel on a south-facing Southern California roof produces roughly 1.7–1.9 kWh per day and 620–680 kWh per year, per NREL PVWatts v8 (14% system losses, 20° tilt, south-facing).
- The Inland Empire (Riverside) leads SoCal at ~1,694–1,718 kWh per kW per year; coastal San Diego trails at ~1,525–1,692 kWh per kW per year due to marine layer.
- A panel's output declines by roughly 0.25–0.50% per year; premium HJT and IBC panels warrant as little as 0.25%/yr and 92% output at year 25.
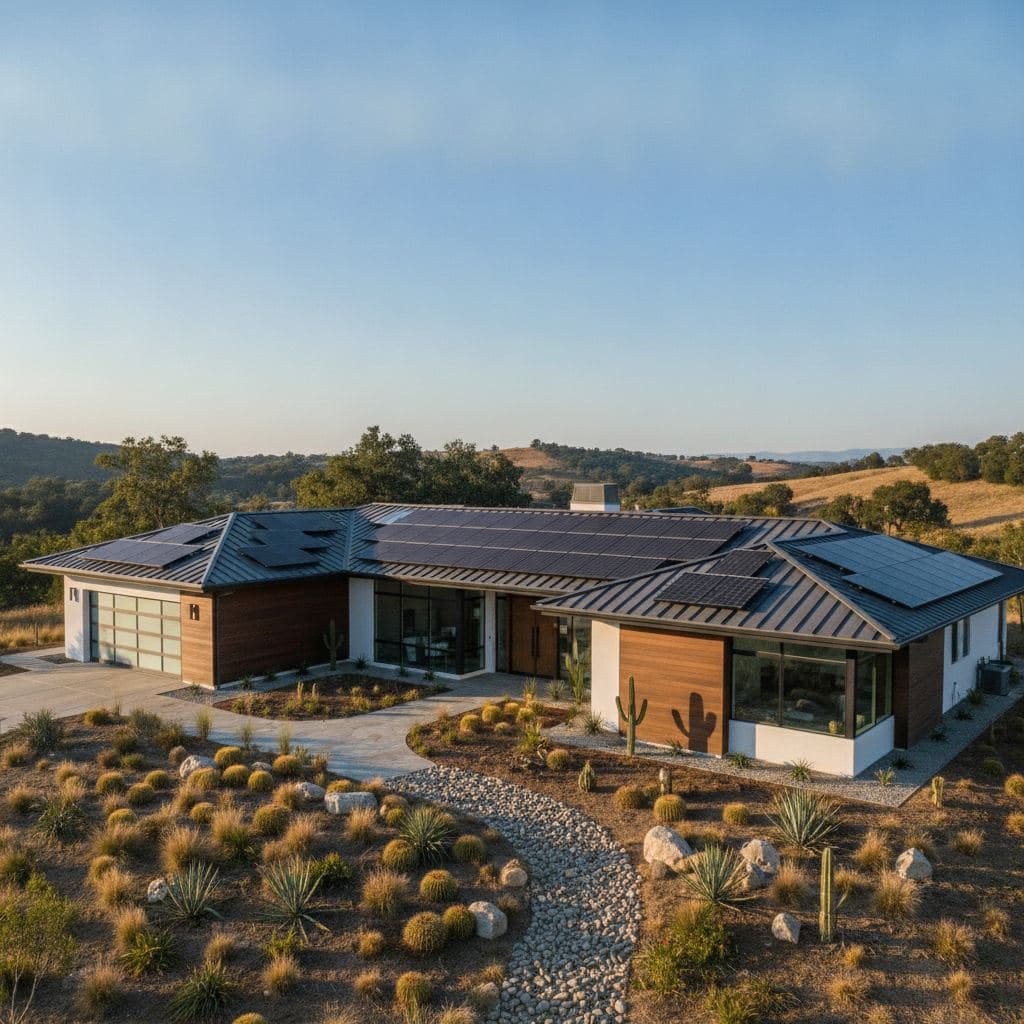
A 400 W solar panel on a typical Southern California roof produces approximately 1.7–1.9 kWh per day and 620–680 kWh per year, based on NREL PVWatts v8 modeled production for a south-facing, 20°-tilt roof with 14% system losses. Scale that to a full system: a 10 kW array in Los Angeles produces roughly 16,770 kWh per year — enough to cover the average SoCal home's annual electricity use with room to spare.
Last verified: November 2026 by Helios Energy Global.
Watts vs. kWh: the number that actually matters on your bill
Every panel has a nameplate wattage — the DC power it produces under Standard Test Conditions (STC): 1,000 W/m² of irradiance, 25 °C cell temperature, no wind. That number is a lab snapshot, not a promise of daily output.
Watts measure instantaneous power. Kilowatt-hours (kWh) measure energy over time — and kWh is what your utility bills you for. A 400 W panel sitting in full sun for one hour produces 0.4 kWh. Over five peak sun hours in a SoCal summer day, that same panel produces roughly 2 kWh before losses. After real-world losses, it delivers about 1.7–1.9 kWh to your meter.
The formula:
Daily kWh ≈ Panel watts ÷ 1,000 × Peak sun hours × (1 − system loss fraction)
For Los Angeles: 0.40 kW × 5.5 peak sun hours × 0.86 (14% losses) × 0.96 (inverter) ≈ 1.84 kWh/day. That matches NREL's PVWatts output for the city almost exactly.
What panels actually produce in 2026: nameplate wattage ranges
The top residential panels in 2026 cluster around 430–440 W: the Q CELLS Q.TRON G2+ at 430 W and 22.5% efficiency, the REC Alpha Pure-RX at 430 W and 22.6% efficiency, the Panasonic EverVolt HK Black at 430 W and 22.2% efficiency, and the Maxeon 7 at 440 W and 24.0% efficiency.
Per current brand datasheets and independent reviews: the REC Alpha Pure-RX runs 405–460 W at 22.1–22.3% efficiency with a −0.24%/°C temperature coefficient; the Maxeon 7 runs 440–475 W at 24.0–24.1% efficiency; and Qcells Q.ANTUM NEO / Q.TRON panels run 400–425 W at 21.4–22.0% efficiency with a −0.30 to −0.34%/°C temperature coefficient.
The Maxeon 6 series is rated around 440 W and roughly 22.8% efficiency, backed by a 40-year warranty. For panels you are actually likely to see on a Helios quote, see our guide to the best solar panels for 2026.
Key takeaway: The difference between a 400 W and a 440 W panel is about 10% more energy per panel — meaningful when roof space is limited, less so when it isn't. What matters most is the system's total kW, not any single panel's wattage.
City-by-city production table: Southern California
The table below shows estimated annual output for one 400 W panel and for each 1 kW of installed capacity, modeled with NREL PVWatts v8 (NSRDB TMY weather data, standard crystalline module, fixed roof mount, 20° tilt, 180° south azimuth, 14% system losses). System totals are estimates.
| Location | Utility context | kWh / kW / year (est.) | kWh / 400 W panel / year (est.) | kWh / panel / day (avg., est.) | 8 kW system annual (est.) |
|---|---|---|---|---|---|
| Los Angeles | LADWP (muni NEM) | ~1,677 | ~671 | ~1.84 | ~13,420 kWh |
| Orange County (Santa Ana) | SCE (NEM 3.0) | ~1,702 | ~681 | ~1.87 | ~13,620 kWh |
| Inland Empire (Riverside) | RPU or SCE | ~1,694–1,718 | ~678–687 | ~1.86 | ~13,550–13,740 kWh |
| San Diego | SDG&E (NEM 3.0) | ~1,525–1,692 | ~610–677 | ~1.67–1.85 | ~12,200–13,540 kWh |
Sources: NREL PVWatts v8 runs reported by NRG Clean Power (October 2026) for Los Angeles, Riverside, and San Diego; solar.com PVWatts v8 model for Riverside (2026). All figures are estimates; your address, roof pitch, azimuth, and shading will move the number.
Per NREL PVWatts v8 runs (south-facing, 20° tilt, 14% losses, October 2026), Los Angeles produces about 1,677 kWh per kW per year, or 671 kWh per 400 W panel per year — averaging 1.84 kWh per panel per day.
Riverside (Inland Empire) comes in at about 1,694 kWh per kW per year, or 678 kWh per 400 W panel per year, averaging 1.86 kWh per day — the strongest performer in the SoCal region.
Riverside's inland sun peaks right on top of AC season, making summer production especially valuable for homeowners with high cooling loads.
San Diego models at about 1,675 kWh per kW per year for a south-facing roof, or roughly 670 kWh per 400 W panel per year. However, coastal marine layer costs more production than the small latitude advantage returns — some models put San Diego as low as 1,525 kWh per kW-year, roughly 10% below Los Angeles, which can mean one or two extra panels on a typical house.
Orange County (Santa Ana/Irvine corridor, SCE territory) sits between LA and Riverside at roughly 1,700–1,720 kWh per kW per year — similar to LA but with slightly more inland sun exposure depending on how far east the home sits.
Utility note: Orange County and most of San Diego are SCE and SDG&E territory — both investor-owned utilities subject to NEM 3.0 (Net Billing Tariff). That means solar exports earn avoided-cost rates, not retail rates, making battery storage far more valuable there. Most of Los Angeles is LADWP — a municipal utility that still offers retail-rate net metering, so export value is meaningfully higher. Riverside homes may be on Riverside Public Utilities (RPU), another municipal utility with its own net metering program. See our NEM 3.0 explainer and solar vs. battery under NEM 3.0 for the full picture.
The losses between panel and meter
A panel rated at 400 W DC does not deliver 400 W to your outlets. Every system has losses between the panel surface and your utility meter. The NREL PVWatts manual specifies a default total system loss of 14%, broken into components including soiling (2%), wiring (2%), shading, mismatch, light-induced degradation, nameplate tolerance, and availability — with the inverter modeled separately at approximately 96% efficiency.
NREL PVWatts v8 uses this 14% default as a derate factor of 0.86 on the DC side, meaning about 86% of nameplate DC energy reaches the AC side before the inverter — and roughly 82–83% reaches your meter after inverter losses are included.
Here is what each loss bucket means in plain English:
- Inverter conversion (~4%): DC power from the panels must be converted to AC. Modern string and microinverters run at roughly 96–97% efficiency, so you lose 3–4% here.
- Wiring resistance (~2%): Current flowing through conductors generates heat. Longer wire runs and undersized conductors increase this.
- Soiling (~2%): Dust, pollen, bird droppings, and grime reduce how much light reaches the cells. In the Inland Empire's dry seasons, chronic soiling can add an effective 3–7% output loss that mimics accelerated degradation in monitoring data — a good reason to wash panels once or twice a year.
- Shading and mismatch (~3–5% combined): Even partial shade on one panel can drag down an entire string. Microinverters or DC optimizers mitigate this significantly.
- Temperature: This is the big one that surprises homeowners. Standard Qcells panels carry a temperature coefficient of −0.30 to −0.34%/°C , meaning output drops roughly 0.3% for every degree Celsius above 25 °C. On a 90 °F (32 °C) Riverside summer afternoon, a panel's cell temperature can exceed 60 °C — cutting output by 10–12% from nameplate, on top of the 14% system loss. The REC Alpha Pure-RX's temperature coefficient of −0.24%/°C makes it one of the better performers in SoCal heat.
The 14% default may not match your specific installation — consider increasing it to 16–20% for installations with partial shading, high soiling rates, or challenging environmental conditions.
How orientation, tilt, and shade move the number
Azimuth (direction the panels face) matters most. South-facing is the gold standard in the Northern Hemisphere, maximizing annual production. But most SoCal roofs are not perfectly south-facing.
- South-facing (180°): Baseline — 100% of potential production.
- Southwest or Southeast (135°–225°): Roughly 95–98% of south-facing output. Minimal penalty.
- West-facing (270°): Approximately 85–90% of south-facing output — but production peaks in late afternoon, which aligns better with SCE's 4–9 PM peak pricing window under NEM 3.0. For SCE customers, a west-facing array can actually be more valuable even if it produces fewer total kWh.
- East-facing (90°): Similar total output to west (~85–90%), but production peaks in the morning.
- North-facing: Generally avoided for primary arrays; can lose 20–30% of potential production.
Tilt has a smaller effect in Southern California. At LA's latitude (~34°N), a 20–25° tilt is close to optimal for annual production. Flat roofs (0°) lose roughly 5–10%; steeper pitches above 35° lose a similar amount.
Shade is the biggest variable. Even 10% shading on one panel can cut a string's output by 50% or more without panel-level electronics. If your roof has chimneys, vents, or neighboring trees, ask your installer to model shading losses explicitly — not just apply the 14% PVWatts default.
For the full breakdown of roof direction tradeoffs in California, see our guide to the best direction for solar panels in California. For roof-type considerations — tile, shingle, flat — see our roof types guide.
From kWh per panel to system size
Once you know how many kWh one panel produces in your city, sizing is arithmetic:
System kW needed = Annual kWh usage ÷ kWh per kW per year (your city)
Example: An LA home using 12,000 kWh/year on LADWP: 12,000 ÷ 1,677 = 7.2 kW → about 18 panels at 400 W (or 17 at 430 W).
Example: The same home in San Diego on SDG&E (using 1,600 kWh/kW as a mid-range estimate): 12,000 ÷ 1,600 = 7.5 kW → about 19 panels at 400 W.
The sizing method, including how to read your bill and account for future loads like an EV, is covered in detail in our guide to how many solar panels you need in California and our solar system size calculator guide.
For installed cost context: solar runs approximately $2.50–$3.50 per watt in Southern California before incentives — so that 7.2 kW LA system would run roughly $18,000–$25,200 all-in. See solar panel cost in California for the full breakdown. Get the gross price and cost per watt in writing from any installer you are comparing.
How production declines with age
No panel produces the same output in year 25 as it did in year one. The decline is called degradation and it is slow, predictable, and warrantied.
NREL's PV Fleet Performance Data Initiative measured a median degradation rate of 0.5% per year across real-world silicon module fleets — meaning a 400 W panel still delivers roughly 350 W at year 25.
Premium panels do significantly better. REC Alpha (HJT) and SunPower Maxeon (IBC) both warrant no more than 0.25%/year degradation, with a minimum 92% output at year 25. Standard PERC panels from most brands warrant 0.55%/year with 80–84% at year 25.
By technology: PERC panels degrade at 0.45–0.55% per year; TOPCon at 0.30–0.40%; HJT at 0.25–0.35%. Tier-1 manufacturers generally guarantee 80–85% output after 25 years, with premium lines guaranteeing 92%.
What that means in kWh: A 400 W panel producing 671 kWh/year in year one (Los Angeles, south-facing) will produce approximately:
- Year 10: ~639 kWh (at 0.5%/yr) or ~654 kWh (at 0.25%/yr)
- Year 25: ~588 kWh (at 0.5%/yr) or ~618 kWh (at 0.25%/yr)
The gap between a 0.25%/yr premium panel and a 0.50%/yr standard panel is roughly 30 kWh per panel per year by year 25 — about $10–15/year per panel at SoCal rates, which adds up across a 20-panel system over a 25-year period.
NREL found that climate is among the most significant predictors of degradation rate. Hot, high-UV climates like the Inland Empire are associated with accelerated degradation compared to mild Pacific coastal climates — one reason premium panel technology pays off more in Riverside or the San Fernando Valley than it does in Santa Monica.
For the full lifespan and degradation picture, see our guide to how long solar panels last.
Putting it all together: a real Southern California roof
Here is a worked example for a Santa Monica home (LADWP, west-facing roof at 20° tilt, mild coastal climate):
- Panel: 430 W, 22.5% efficiency, 0.30%/yr degradation
- Roof azimuth penalty: West-facing, ~88% of south-facing output
- Adjusted kWh/kW/year: 1,677 × 0.88 = ~1,476 kWh/kW/year
- System size: 8 kW (19 panels at 430 W)
- Year-one production: 8 × 1,476 = ~11,810 kWh
- Year-25 production: ~10,790 kWh (at 0.30%/yr degradation)
- LADWP effective rate: ~28¢/kWh (26–31¢ effective)
- Year-one bill offset value: ~$3,310
Because this home is on LADWP's retail-rate net metering — not NEM 3.0 — every kWh exported earns full retail credit, making the west-facing orientation less of a penalty than it would be for an SCE customer.
Frequently asked questions about solar panel power output
How many kWh does a 400 W solar panel produce per day in Los Angeles?
In Los Angeles, a 400 W panel on a south-facing roof at 20° tilt produces about 1.84 kWh per day on average — roughly 671 kWh per year — per NREL PVWatts v8 (14% system losses, October 2026 run). That average includes short winter days and long summer days; June production can be nearly double December production.
Does a west-facing roof produce enough solar to be worth it?
Yes, in most cases. A west-facing roof in Southern California typically produces 85–90% of what a south-facing roof would produce annually. More importantly, west-facing panels generate power in the late afternoon — exactly when SCE's peak pricing (approximately 48–58¢/kWh from 4–9 PM) applies. For SCE customers on NEM 3.0, the value of that afternoon production can offset the volume penalty. LADWP customers benefit less from this timing effect since they are on retail-rate net metering.
What is the difference between a panel's DC wattage and my meter reading?
The nameplate wattage is a DC measurement under ideal lab conditions. By the time electricity reaches your meter as usable AC power, NREL PVWatts v8 applies a default total system loss of 14%, corresponding to a derate factor of 0.86 on the DC side, or about 0.83 with inverter losses included. Heat, dust, wiring resistance, and inverter conversion all take a cut. Real-world AC output is typically 80–86% of DC nameplate.
Does shade from a chimney or tree really matter that much?
It matters a great deal. Even partial shading of one panel in a string can drag down the entire string's output — not just that one panel. Panel-level electronics (microinverters or DC optimizers) limit this effect to the shaded panel only. If your roof has any shade sources, insist that your installer run a shading analysis — not just apply a generic loss factor.
How much does solar panel output decline over 25 years?
Most modern residential solar panels degrade at 0.3–0.5% per year. Premium monocrystalline panels from top manufacturers degrade at the lower end of this range — 0.25–0.3% per year. At 0.5%/yr, a panel that made 671 kWh in year one makes roughly 588 kWh in year 25. At 0.25%/yr, it makes roughly 618 kWh — about 5% more over the life of the system.
How do I know if my installer's production estimate is realistic?
Ask which tool they used (NREL PVWatts or equivalent), what inputs they entered (address, tilt, azimuth, system losses, shading factor), and what the resulting kWh/kW/year figure is. In California, expect about 1,560–1,690 kWh a year for every 1 kW of south-facing panels — if an estimate is significantly above that range for a standard roof, ask why. Also get the gross price and cost per watt in writing so you can compare quotes on an apples-to-apples basis.
Does the Inland Empire really produce more solar than the coast?
Annual output varies only about 8% across California's major cities — from about 1,561 kWh per kW in San Francisco to 1,694 kWh per kW in Riverside. The Inland Empire's advantage over the coast is real but modest on an annual basis. Where it shows up more is in winter months: in the darkest winter month, a panel makes roughly 41 kWh in Riverside compared to about 30 kWh in cooler, cloudier inland cities.
Next steps
- Book a free consultation and custom design — Helios models production for your specific address, roof orientation, and utility before recommending a system size.
- See what a system costs in Southern California — installed price ranges by system size.
- Explore battery storage options — especially important for SCE and SDG&E customers on NEM 3.0, where self-consumption beats exporting.
- Learn how NEM 3.0 changes the solar math — and why your utility (SCE, LADWP, RPU) changes the answer.
- Use our solar system size guide — turn your utility bill into a target system size.
- Read about solar panel dimensions and weight — for roof layout and structural planning.
- Explore all Southern California locations we serve
Sources
- NREL PVWatts Version 5 Manual (system losses methodology, Table 6) — September 4, 2014
- SurgePV — Solar Panel Degradation Rates 2026: by Technology & Warranty — June 1, 2026
- solarcostbystate.com — Best Solar Panels for Home Use in 2026: Top 10 Brands Compared — June 1, 2026
- solar.com — Solar Panels in Riverside, CA (2026): RPU vs SCE, PVWatts v8 production model — October 1, 2026
More guides
Best Solar Companies in Orange County, CA (2026 Rankings)
Our ranked list of the 10 best solar installers in Orange County for 2026, with installed costs running $2.50–$3.50/watt and key differences by utility (SCE, Anaheim APU, SDG&E).
ReadBest Solar Companies in Westlake Village, CA (2026): Honest Rankings for a Unique Market
Westlake Village sits on the SCE/LADWP border with tile roofs, high AC loads, and strong solar potential — here's how to pick the right installer in 2026 without overpaying or getting misled on incentives.
ReadCommunity Solar in California: Does It Actually Exist Yet? (2026)
After more than a decade of legislation, zero community solar projects have been built under California's main framework — but income-qualified renters on SCE can get a 20% bill discount through the DAC-GT green tariff today.
ReadGet a free consultation and custom design.
No pressure, no obligation — the owner reviews every design we send.