Do Solar Panels Work on Cloudy Days and in Winter? Southern California Month-by-Month Production (2026)
Yes — Southern California solar panels produce 10–70% of rated output on cloudy days, and a south-facing 10 kW system in Los Angeles makes roughly 1,000–1,100 kWh in December versus 1,700–1,800 kWh in July.
By Taylor Crouse — Founder, Helios Energy GlobalPublished
Quick answer
- Yes — solar panels work on cloudy days, producing roughly 10–70% of their rated output depending on cloud thickness.
- A south-facing 10 kW system in Los Angeles makes an estimated ~1,050 kWh in December and ~1,750 kWh in July — a winter-to-summer ratio of about 60%, per NREL PVWatts v8 data.
- December output is lower due to shorter days, a lower sun angle, coastal marine layer, and occasional rain — not because panels stop working.
- An El Niño winter adds extra cloud cover risk for Southern California; a battery smooths the daily gap but does not change monthly totals.
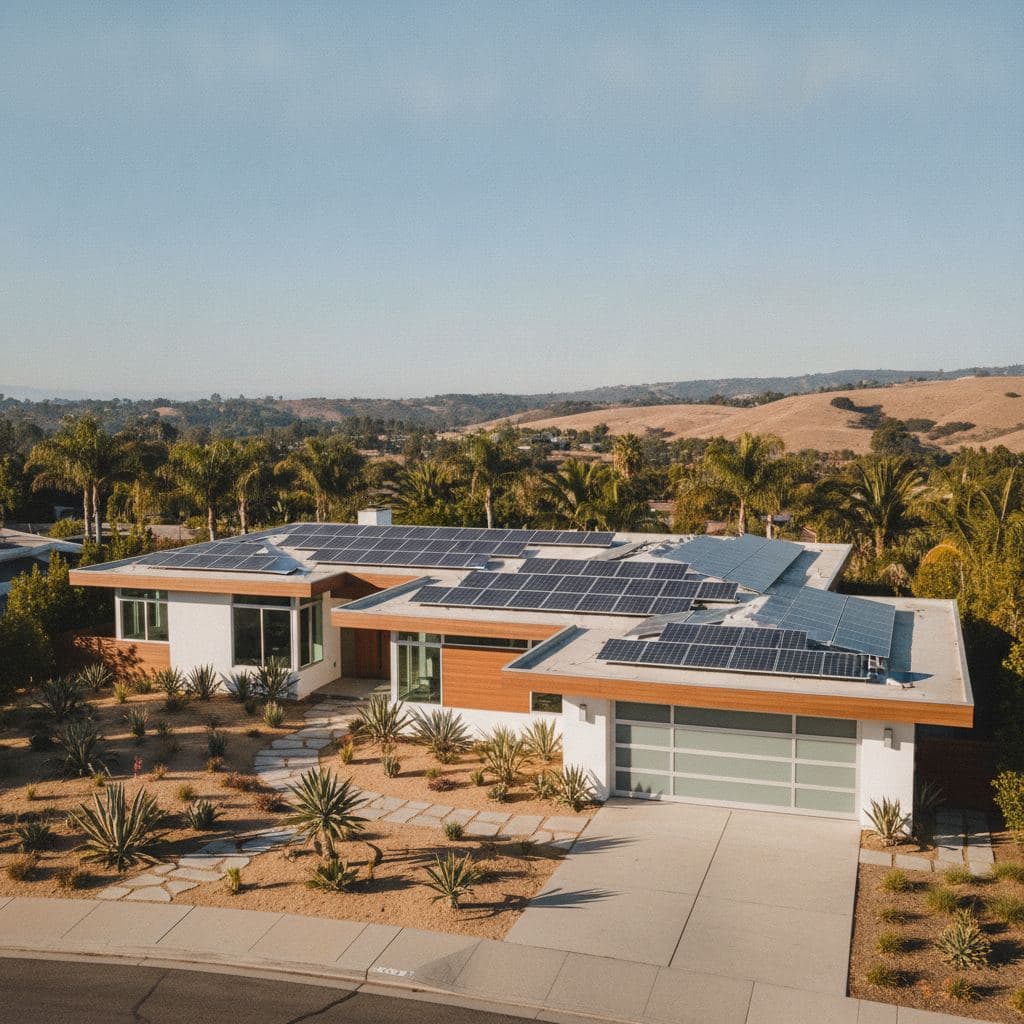
A south-facing 10 kW system in Los Angeles produces roughly 60% as much electricity in December as it does in its peak summer month — not zero, not close to zero, but meaningfully less. On an individual overcast day, the same system still generates electricity: solar panels produce less electricity on cloudy days than under direct sun, with output generally reduced by 10–25% on partly cloudy days, and by more than 60% under heavy overcast with no direct irradiance.
Last verified: November 2026 by Helios Energy Global.
Why panels keep working when the sky goes grey
The physics is straightforward. Solar panels produce electricity on cloudy days via diffuse irradiance — scattered light that passes through clouds even when the sun is hidden.
Diffuse light is weaker, but it still drives production. Modern panels are built to use both direct and diffuse light, so output falls on cloudy days but doesn't go to zero.
What changes with cloud cover is how much output you lose. A mix of clouds and sun can actually improve total solar irradiance, because the clouds can create diffuse irradiance alongside the sun's direct irradiance. A thin marine layer on a Santa Monica morning is very different from a dense storm cloud rolling in from the Pacific:
Partly cloudy (scattered clouds): NREL irradiance data shows that partly cloudy days typically deliver 50–80% of clear-sky production.
Overcast (uniform grey sky): On heavy overcast days, systems produce about 10–25% of peak output.
Heavy storm clouds: Under heavy overcast skies with no direct irradiance, output could reduce by more than 60%.
Southern California's marine layer — the low stratus that hugs the coast from Santa Monica to Huntington Beach on summer mornings and winter afternoons — sits in the moderate-to-overcast range. It typically burns off by midday, so a coastal system loses a few morning hours of peak production but recovers by afternoon. Inland cities like Riverside, Ontario, and Temecula see far less of it.
For roof direction and tilt guidance that affects how your system handles low-angle winter sun, see our guide on best direction for solar panels in California and north-facing roof considerations.
Month-by-month production: what NREL PVWatts shows for Southern California
The table below uses NREL PVWatts v8 data for a south-facing roof at 20° tilt with 14% system losses — the standard residential inputs. Source: NREL PVWatts v8 (NSRDB TMY weather data), standard module, fixed roof mount, 20° tilt, 180° (south) azimuth, 14% system losses, October 2026. Monthly figures are scaled from published per-kW outputs; all values are estimates — your actual roof will vary with shading, tilt, and local microclimate.
| Month | LA / OC (kWh per kW) | Inland Empire (kWh per kW) | San Diego (kWh per kW) | 10 kW LA system (est. kWh) |
|---|---|---|---|---|
| January | ~110 | ~115 | ~108 | ~1,100 |
| February | ~125 | ~130 | ~122 | ~1,250 |
| March | ~155 | ~160 | ~152 | ~1,550 |
| April | ~165 | ~170 | ~163 | ~1,650 |
| May | ~165 | ~172 | ~162 | ~1,650 |
| June | ~165 | ~175 | ~163 | ~1,650 |
| July | ~175 | ~182 | ~172 | ~1,750 |
| August | ~170 | ~178 | ~168 | ~1,700 |
| September | ~155 | ~162 | ~153 | ~1,550 |
| October | ~140 | ~148 | ~138 | ~1,400 |
| November | ~115 | ~122 | ~113 | ~1,150 |
| December | ~105 | ~112 | ~103 | ~1,050 |
| Annual total | ~1,650–1,700 | ~1,700–1,730 | ~1,620–1,680 | ~16,500–17,000 |
Estimates based on NREL PVWatts v8 per-kW monthly outputs for Los Angeles, Riverside, and San Diego. Inland Empire (Riverside) figures per NREL PVWatts via published datasets. All values are planning estimates; run PVWatts for your exact address before sizing.
The winter-to-summer ratio in plain numbers: For Los Angeles, NREL PVWatts v8 shows a best month (August) of about 69 kWh per 400 W panel and a worst month (December) of about 40 kWh — December is roughly 58% of August's output.
For San Diego, NREL PVWatts v8 shows August at about 67 kWh per 400 W panel and December at about 43 kWh — a winter-to-summer ratio of 64%.
The Inland Empire (Riverside) produces about 1,718 kWh per kW per year on a south-facing roof — higher than coastal Los Angeles because the marine layer rarely reaches it. That translates to slightly better December numbers too. For a deeper dive on system sizing by city, see our guide on how many solar panels you need in California.
Why December is the low point
Four things stack up against December production:
1. Shorter days. Los Angeles gets roughly 10 hours of daylight in late June but only about 9 hours 50 minutes in late December — and the sun rises and sets at a much shallower angle, meaning fewer peak-production hours in the middle of the day.
2. Lower sun angle. The sun's arc across the sky is lowest in December, so panels at a fixed 20° tilt receive less direct irradiance per hour. A south-facing roof handles this better than any other orientation — another reason we link our best direction guide.
3. Marine layer and overcast. In Los Angeles during winter, average daily high temperatures are level around 68°F and the fraction of time spent overcast or mostly cloudy increases from 35% to 42%. The peak cloudiness arrives in late February, but December marks the start of the wetter, greyer stretch.
4. Rain. Los Angeles's rainy season runs roughly November through March. The average sliding 31-day rainfall during the winter in Los Angeles is rapidly increasing, starting the season at 1.5 inches and ending the season at 3.2 inches. Rain days are low-production days — but rain also cleans your panels for free, which partially offsets the loss over the season.
What an El Niño winter adds
According to the National Weather Service, Southern California is generally much more impacted by El Niño, with El Niño conditions bringing higher than normal precipitation.
An El Niño winter is more likely than not to see below-average irradiance across most of North America, as El Niño brings cloudier, wetter conditions.
A study published in March 2026 linked earlier super El Niño events to nearly 5% less potential solar output over 12 months in parts of California. In practical terms: an El Niño winter might push your December and January production 5–10% below a typical year's NREL estimate. That is a real but modest effect — it does not change the fundamental math of going solar.
What winter production is actually worth: SCE vs. SDG&E
Lower kWh output in winter is only half the story. What matters to your bill is the value of each kilowatt-hour — and that changes by utility and by time of day.
SCE customers (most of LA County, Orange County, Inland Empire)
SCE's time-of-use rates mean that a kilowatt-hour exported or self-consumed during the 4–9 PM peak is worth significantly more than one produced at noon on a Saturday. In winter, peak hours shift slightly but remain in the late afternoon — which is also when solar production is tapering off. The practical effect: winter solar production in the 2–5 PM window still hits some of the peak window, but December's shorter days mean fewer peak-window hours of generation. For a full breakdown of how SCE's rate tiers interact with your solar production, see our guide on SCE time-of-use rates explained. Under NEM 3.0 (the CPUC Net Billing Tariff, which applies to SCE customers), exported power earns a lower avoided-cost credit rather than retail rate — which is why pairing a battery with solar makes more sense for SCE customers than it did under older net metering rules. Our NEM 3.0 explainer and solar vs. battery under NEM 3.0 guides walk through the numbers.
SDG&E customers
SDG&E has the highest average residential rates in California at roughly 46¢/kWh, so even a December day producing 60% of July's output still offsets expensive grid power. SDG&E is also an investor-owned utility under NEM 3.0, so the same export-credit dynamics apply. Winter peak hours (4–9 PM) at SDG&E carry high rates, but a south-facing system in San Diego produces relatively little after 4 PM in December. A battery captures that midday solar surplus and discharges it during the peak window — the single biggest financial lever for SDG&E homeowners in winter. See our SDG&E time-of-use rates guide for the current rate schedule.
LADWP customers (City of Los Angeles)
LADWP is a municipal utility and is not on NEM 3.0. LADWP still offers near-retail-rate net metering, crediting exported solar at close to the full retail rate. LADWP credits exported solar at or near the full retail rate — roughly one-for-one — not at NEM 3.0's low export values. LADWP's 2026 residential rate runs about 26.4¢/kWh Tier 1 and 32.3¢/kWh Tier 2 in summer. Winter rates are lower, but the near-retail credit structure means every December kilowatt-hour your system exports is worth far more to an LADWP customer than to an SCE or SDG&E customer on NEM 3.0.
Why a winter production deficit is normal — and expected
Under NEM 3.0 (SCE, SDG&E) and LADWP's net metering, your system is designed around an annual offset, not a monthly one. You build up surplus credits in spring and summer — when the system overproduces — and draw those credits down in winter. This is called the annual true-up cycle. Our guide on how California's annual solar billing works explains how to read your statement and what a normal winter deficit looks like.
If your December bill shows a credit balance being drawn down, that is the system working exactly as designed. If it shows a large unexpected charge, that is worth investigating.
How a battery changes the winter picture
A battery does not increase your monthly production — December sun is December sun. What it does is shift when you use the electricity you do produce, which matters for two reasons:
- Peak-rate avoidance. Under SCE and SDG&E's time-of-use rates, storing midday solar and discharging at 4–9 PM saves you from buying expensive peak power even on short winter days.
- Backup during outages. Winter storms in Southern California can knock out power. A battery keeps your lights, refrigerator, and medical equipment running when the grid goes down. See our guide on whether solar panels work during a power outage — the short answer is: panels alone do not, but panels plus a battery do.
Helios installs the Tesla Powerwall 3 (installed $14,500–$18,500 for one unit, $24,000–$30,000 for two), the Enphase IQ Battery 10C ($13,000–$15,500 installed), and the FranklinWH aPower 2 with aGate ($16,000–$21,000 installed). Note that California's SGIP residential battery incentive budget is waitlisted in 2026 — we will update this page when new funds open. See our battery storage overview for current options.
What to check if winter output looks lower than expected
A drop from July to December is normal. A drop that is steeper than the seasonal profile above — or output that barely moves on a clear winter day — is worth investigating. Common culprits:
- Shading from winter sun angle. A tree or chimney that cast no shadow in summer may shade panels for several hours in December when the sun is low.
- Soiling. Dust and pollen build up in dry stretches; rain usually clears it, but check after a long dry spell.
- Inverter or optimizer fault. A single failed microinverter or power optimizer can cut one panel's output to near zero without tripping a whole-system alarm.
- Monitoring gap. Some monitoring apps show a rolling 30-day average; a December reading compared to a July reading will always look low.
Our guide on what to check when your solar output looks off walks through a step-by-step diagnostic. If you find a genuine fault, contact your installer — Helios systems come with production monitoring and a workmanship warranty.
Frequently asked questions about solar panels on cloudy days and in winter
Do solar panels work when it's raining in Southern California?
Rain clouds are thick and block most direct sunlight, but diffuse light still reaches the panels — expect roughly 40–60% of rated output on a light-rain day. Heavy downpours with dense cloud cover push output lower, but rain also washes dust and pollen off panels, which can improve output on the sunny days that follow.
How much does Southern California cloud cover actually reduce annual solar production?
Very little on a yearly basis. The NREL PVWatts model already accounts for average cloud cover using decades of actual weather data for each location. Every major California city lands within about 8% of every other on yearly solar output — including cloudier coastal cities versus sunnier inland ones. The model's ~1,650–1,720 kWh per kW per year for Southern California already bakes in typical marine-layer days.
Is the Inland Empire significantly better for solar than coastal LA?
Yes, modestly. Riverside in the Inland Empire produces about 1,718 kWh per kW per year on a south-facing roof , compared to about 1,676 kWh for Los Angeles — roughly a 2–3% advantage, primarily because the marine layer rarely penetrates inland. Over a 10 kW system's life, that adds up, but it is not the primary driver of whether solar makes sense.
Will an El Niño winter meaningfully hurt my solar payback?
It can trim winter production by a few percent. A study published in March 2026 linked super El Niño events to nearly 5% less potential solar output over 12 months in parts of California. Over a 25-year system life, one or two El Niño winters are already embedded in the long-run average that NREL's weather data reflects. Do not let a wet winter forecast change your go/no-go decision.
Should I wait until spring to install solar so I don't "miss" winter production?
No. Installing in November or December means your system is producing — even at 60% of peak — rather than producing nothing while you wait. You also lock in your utility interconnection date, which determines which net metering tariff applies. Every month you wait is a month of production and bill offset you do not get back.
Do I need a battery to make solar worthwhile in winter?
Not necessarily — it depends on your utility. LADWP customers on retail-rate net metering get full credit for every kilowatt-hour they export, so a solar-only system still makes strong financial sense in winter. SCE and SDG&E customers on NEM 3.0 earn lower export credits, so a battery that shifts self-consumption to the peak window improves winter economics meaningfully. See our batteries page and the NEM 3.0 guide for the numbers.
How do I know if my winter output is normal or something is wrong?
Compare your monthly production to the per-kW figures in the table above, scaled to your system size. If December output is roughly 55–65% of your best summer month and the system is monitoring green, you are on track. If output is well below that range on clear days, run through the checklist in our solar output diagnostic guide.
Next steps
- Book a free consultation and custom design — Helios will run a PVWatts estimate for your exact address and show you a month-by-month production profile before you commit to anything.
- Explore our battery storage options — see which battery makes the most sense for your utility and usage pattern.
- Understand NEM 3.0 and net billing — know what your exported winter kilowatt-hours are actually worth.
- Solar vs. battery under NEM 3.0 — the financial case for adding storage on SCE or SDG&E.
- How many panels does your home need? — size your system for the full annual cycle, not just summer.
- See our Southern California locations — Helios serves Santa Monica, the Westside, the San Fernando Valley, Orange County, and the Inland Empire.
- Get a design and savings estimate — see your projected production, utility bill impact, and payback period.
Sources
- NWS / Weather Spark — Los Angeles Winter Cloud Cover — January 2026
- NWS Sacramento — ENSO Information for Northern California (Southern California note) — January 2026
- pv magazine USA — El Niño threatens U.S. winter solar generation (Solcast / NOAA analysis) — August 25, 2023
- Aurora Solar — Do solar panels work on cloudy days — September 2026
More guides
Enphase Warranty Explained: IQ8 Microinverters, IQ Battery 10C, and Who Replaces a Failed Unit in California (2026)
Enphase IQ8 microinverters carry a 25-year limited warranty; the IQ Battery 10C is covered for 15 years or 6,000 cycles at 60% capacity retention — and both warranties survive even if your original installer closes.
ReadThe 10 Best Solar Companies in Hermosa Beach, CA (2026): A Compact-Roof, Coastal-Honest Guide
Hermosa Beach roofs are small, salty, and SCE NEM 3.0 territory — every panel placement counts. Here's who does it right in 2026, led by Helios Energy Global.
ReadIs there a California solar tax credit in 2026? What homeowners actually get
California has no state solar tax credit, and the federal 30% credit expired December 31, 2025 — but a prepaid lease still delivers roughly 30% off in 2026.
ReadGet a free consultation and custom design.
No pressure, no obligation — the owner reviews every design we send.