What is the solar payback period in California in 2026?
In 2026, most Southern California homeowners see a solar payback period of 10–14 years solar-only, or roughly 6–9 years when pairing solar with a battery under NEM 3.0.
By Taylor Crouse — Founder, Helios Energy GlobalUpdated
Quick answer
- Solar-only payback in Southern California: roughly 10–14 years in 2026
- Solar + battery payback under NEM 3.0 (SCE): roughly 6–9 years
- LADWP and other municipal utility customers: solar-only payback closer to 12–18 years due to lower retail rates (~28¢/kWh vs. SCE's ~34–35¢/kWh)
- The 30% federal solar tax credit expired December 31, 2025 — it does not apply to 2026 purchases
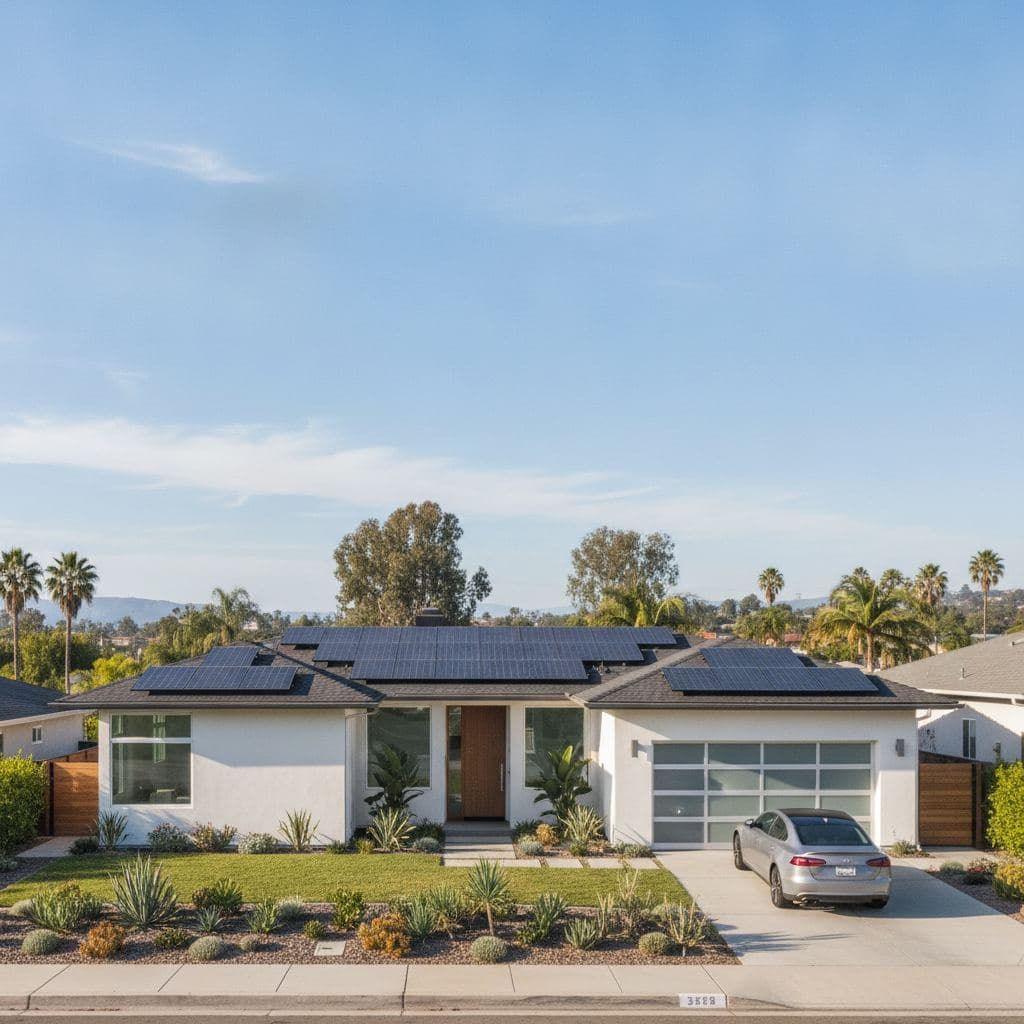
A typical Southern California homeowner on SCE installing solar-only in 2026 can expect a payback period of 10–14 years; add a battery and that range compresses to roughly 6–9 years because stored energy replaces expensive peak power instead of being exported at low NEM 3.0 export rates. LADWP customers face a longer solar-only payback of approximately 12–18 years because their base rate is roughly 35–40% lower than SCE's.
Last verified: September 2026 by Helios Energy Global.
Why 2026 is a different calculation than prior years
Two things changed the math significantly entering 2026:
1. The 30% federal tax credit is gone. The residential clean energy credit under IRC §25D expired at the end of 2025. A system that cost $18,000 in 2024 effectively cost $12,600 after the credit. That same system costs $18,000 today — a $5,400 increase in net cost with no federal offset. Any payback estimate you read from 2024 or 2025 is no longer accurate without adjusting for this.
2. NEM 3.0 export rates remain low for IOU customers. SCE, PG&E, and SDG&E customers are on the Net Billing Tariff (NEM 3.0), which pays export rates averaging roughly 5–8¢/kWh for daytime solar sent to the grid — far below the ~34–35¢/kWh retail rate you'd pay to buy that same power back at night. That gap is why batteries now shorten payback so dramatically for SCE customers: instead of exporting cheap, you store and self-consume expensive.
The numbers: a side-by-side payback table
The table below uses a representative 8 kW solar system and a single-battery configuration. All figures are estimates based on 2026 installed cost ranges, utility rate data, and typical Southern California production (EIA data, NREL PVWatts).
| Scenario | Utility | Est. System Cost (before incentives) | Est. Annual Savings | Est. Payback Period |
|---|---|---|---|---|
| Solar only (8 kW) | SCE | $20,000–$28,000 | ~$1,600–$2,000/yr | 10–14 years |
| Solar + 1 battery | SCE | $34,000–$46,500 | ~$3,500–$5,000/yr | 6–9 years |
| Solar only (8 kW) | LADWP | $20,000–$28,000 | ~$1,200–$1,600/yr | 12–18 years |
| Solar + 1 battery | LADWP | $34,000–$46,500 | ~$1,800–$2,400/yr | 14–19 years |
| Solar only (8 kW) | Anaheim APU / Riverside RPU | $20,000–$28,000 | ~$1,300–$1,700/yr | 11–16 years |
All costs and savings are estimates. Battery cost assumes one unit at ~$14,000–$18,500 installed. Annual savings vary by roof orientation, shading, usage pattern, and rate plan.
SCE customers: why battery changes everything
SCE's TOU-D and TOU-D-PRIME rate plans carry a peak window of roughly 4–9 PM, when rates hit their highest point — often 50¢/kWh or more on summer days. Solar panels produce most of their energy between 9 AM and 3 PM, which is before the peak window. Under NEM 3.0, that midday surplus exported to the grid earns you only about 5–8¢/kWh in export credit.
A battery changes the equation: instead of exporting at 6¢, you store midday solar and discharge it during the 4–9 PM peak, avoiding 50¢+ grid power. That self-consumption arbitrage is what drives the 6–9 year payback range for solar + battery SCE customers.
The practical implication: if you're on SCE and you're debating solar-only vs. solar + battery, the battery is not just a backup device — it's a payback accelerator. Explore the full analysis on our solar vs. battery under NEM 3.0 guide.
LADWP customers: different math, different conclusion
LADWP is a municipal utility and is not subject to NEM 3.0. As of 2026, LADWP still offers retail-rate net metering — meaning excess solar you export to the grid earns you a credit at roughly the same rate you pay to buy power (~28¢/kWh). That's genuinely better export compensation than SCE's NEM 3.0 rates.
However, LADWP's base retail rate of approximately 28¢/kWh is substantially lower than SCE's ~34–35¢/kWh. Lower rates mean smaller annual savings from the same solar system, which stretches payback out to roughly 12–18 years solar-only.
The battery math for LADWP is also different. Because export rates are already near retail, there's less arbitrage value in storing energy versus exporting it. Batteries still provide backup and bill management value, but they don't compress payback the same way they do for SCE customers. Adding a battery on LADWP typically does not dramatically shorten payback — it may add 1–3 years of additional cost recovery time before the battery's own value justifies it.
Other municipal utilities in the region — Anaheim APU, Riverside RPU, Burbank, Glendale, Pasadena PWP — each run their own net metering programs. Rates and export compensation vary. Our locations page outlines which utilities we serve and how the math differs.
What actually moves your payback number
Payback is not one number — it's a range shaped by several variables. Here's what matters most:
- Your current electricity bill. A household spending $350/month on SCE will see faster payback than one spending $150/month. Higher consumption = more savings = shorter payback.
- Roof orientation and shading. South-facing, unshaded roofs in SoCal produce the most kilowatt-hours. East/west-facing systems produce 15–20% less annually (NREL PVWatts data), stretching payback proportionally.
- System size vs. consumption match. Oversizing to export surplus is less valuable under NEM 3.0. Right-sizing to your actual usage — or slightly under — optimizes payback for SCE customers.
- Battery count and dispatch strategy. One battery paired with a well-configured TOU dispatch schedule is the most payback-efficient configuration for most SCE homes.
- No federal tax credit in 2026. This alone adds roughly 2–3 years to payback compared to a 2024 install at the same system price.
- California property tax exclusion. California still excludes solar from property tax reassessment, which is a real financial benefit — it just doesn't show up in payback calculations directly.
- SGIP battery rebate. The Self-Generation Incentive Program offered meaningful battery rebates in prior years. As of 2026, residential SGIP budgets are waitlisted — don't count on this in your payback math until your contractor confirms active funding.
For a roof-specific production estimate, see our roof types guide and solar panel cost page.
How to calculate your own payback
The formula is straightforward:
Payback (years) = Net System Cost ÷ Annual Bill Savings
Where:
- Net system cost = installed price minus any applicable state/local incentives (no federal credit in 2026)
- Annual bill savings = estimated annual production (kWh) × your effective rate (¢/kWh), adjusted for export compensation
The tricky part is the "effective rate" for NEM 3.0 customers — it's not simply your retail rate, because some production gets exported at low rates and some displaces high-rate peak consumption. A proper savings estimate requires hour-by-hour modeling against your actual bill, which is what our custom design tool does.
A rough rule of thumb for SCE solar-only: expect to offset 70–85% of your bill in year one, with the battery adding another 10–15% offset by shifting peak consumption.
Frequently asked questions about solar payback period in California
Is the 30% federal solar tax credit still available in 2026?
No. The 30% federal residential solar tax credit (IRC §25D) expired on December 31, 2025. There is no federal income tax credit for residential solar systems installed in 2026. Any quote or online calculator that still includes a 30% credit is using outdated assumptions — ask your installer to confirm.
Why is the payback period longer in 2026 than it was in 2023 or 2024?
Two main reasons: the 30% federal tax credit expired, adding roughly $5,000–$8,000 to the effective net cost of a typical system; and NEM 3.0 export rates for SCE/PG&E/SDG&E customers remain low, reducing the value of excess solar production for solar-only systems. Battery pairing partially offsets the NEM 3.0 impact.
Does adding a battery always shorten payback?
For SCE customers, yes — typically by 3–6 years compared to solar-only, because of the large gap between daytime export rates (~5–8¢/kWh) and evening peak rates (often 45–55¢/kWh). For LADWP customers, the battery's payback benefit is smaller because export rates are already near retail. The answer depends on your utility, rate plan, and how much peak-hour consumption you have. See our batteries page for more detail.
What is a realistic payback period for a solar system on LADWP?
Roughly 12–18 years for solar-only in 2026, based on LADWP's ~28¢/kWh average rate and retail-rate net metering. That's a longer payback than SCE, but LADWP customers also pay less per kilowatt-hour to begin with, so their pre-solar bills are lower. The economics still favor solar over a 25-year system life — you're just waiting longer for breakeven.
Will electricity rates keep rising and shorten my actual payback?
Historically, California residential rates have risen roughly 3–6% per year (EIA data), which would improve real-world payback compared to static-rate estimates. We don't model rate escalation into our standard payback ranges because it introduces uncertainty, but it's a reasonable tailwind. Even at flat rates, a 10–14 year payback on a 25-year system means 11–15 years of net positive cash flow.
Is SGIP still available to reduce battery costs in 2026?
The Self-Generation Incentive Program (SGIP) residential budget is waitlisted as of 2026. We cannot promise SGIP funding will be available when you install. If budget opens up and your system qualifies, it can meaningfully reduce battery net cost — but don't build your payback math around it until funding is confirmed. Check selfgenca.com for current status.
How does roof direction affect payback in Southern California?
South-facing roofs at roughly 15–25° tilt produce the most annual kWh in SoCal. West-facing roofs produce about 10–15% less annually but generate more power during the 4–9 PM SCE peak window, which can actually improve bill savings under TOU rates. East-facing roofs produce similar annual output to west but front-load production into the morning off-peak period — less valuable under NEM 3.0. Our roof types guide breaks this down by orientation.
Next steps
- Book a free consultation and custom design — we'll model your actual bill, roof, and utility to give you a site-specific payback estimate, not a national average.
- See how we design for maximum savings — our hour-by-hour production model accounts for NEM 3.0 export rates and your TOU rate plan.
- Learn how NEM 3.0 works — understand exactly how SCE export compensation is calculated and why it matters for system sizing.
- Solar vs. battery under NEM 3.0 — a deeper look at why battery pairing shortens payback for SCE customers.
- Battery storage options and costs — current installed cost ranges, brands, and sizing guidance for SoCal homes.
- Solar panel cost in Southern California — 2026 per-watt cost ranges, what's included, and how to compare quotes.
- Locations we serve — utility-specific information for SCE, LADWP, APU, RPU, and other SoCal service territories.
More guides
Generator vs battery backup in California: which is right for you in 2026?
A whole-home generator runs $8,000–$20,000 installed; a home battery runs $14,000–$18,500 — but only the battery earns you money every single day on SCE or LADWP.
ReadSunPower vs Tesla Solar in 2026: How the Two Compare for a California Home
SunPower Inc. (formerly Complete Solaria) offers up to a 40-year panel warranty through its dealer network; Tesla's new TSP-420 panels carry a 25-year warranty and pair natively with Powerwall 3 — here's how to compare them on your Southern California roof.
ReadBest Solar Companies in Long Beach, CA (2026): Honest Rankings for SCE Homeowners
Long Beach homeowners on SCE face NEM 3.0 export rules, a city permit portal that works around the clock, and a vintage housing stock that often needs a panel upgrade before solar goes in. Here are the 10 best solar installers in Long Beach for 2026 — ranked honestly, with the numbers that actually matter.
ReadGet a free consultation and custom design.
No pressure, no obligation — the owner reviews every design we send.