Electricity rates in San Bernardino in 2026
San Bernardino homeowners on SCE pay roughly 34–35¢/kWh on average in 2026, with peak TOU rates climbing above 50¢/kWh on hot summer afternoons.
By Taylor Crouse — Founder, Helios Energy GlobalUpdated
Quick answer
- SCE residential customers in San Bernardino pay roughly 34–35¢/kWh blended average in 2026
- Peak TOU rates (4–9 PM daily) run approximately 50–57¢/kWh in summer under TOU-D-PRIME
- A typical San Bernardino home uses 1,100–1,500 kWh/month in summer due to heavy AC load, producing monthly bills of $375–$525 without solar
- CARE-eligible households receive a ~30–35% discount on their SCE bill; FERA provides roughly ~18%
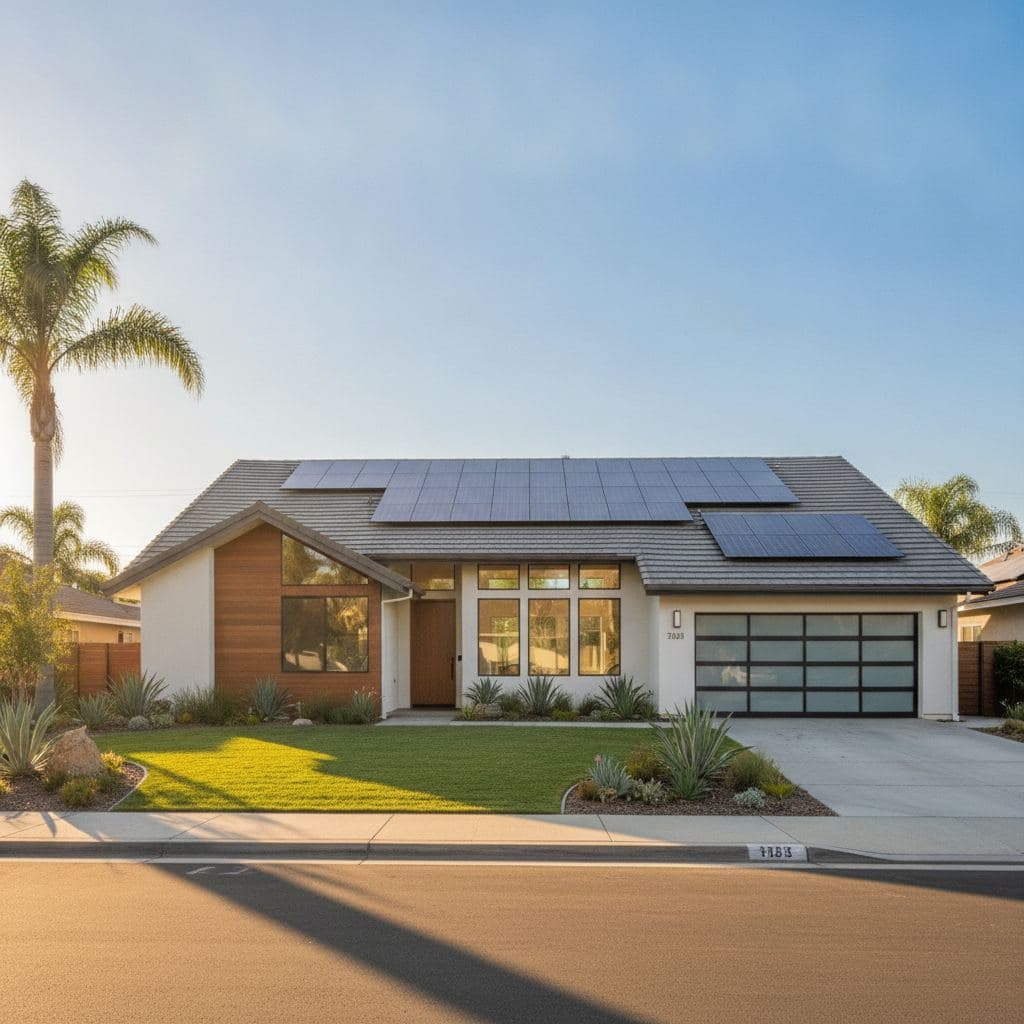
San Bernardino homeowners on Southern California Edison (SCE) face some of the highest residential electricity costs in the Inland Empire, with blended rates averaging roughly 34–35¢/kWh in 2026 — and peak-period rates pushing past 50¢/kWh on summer weekday afternoons. A typical single-family home here runs 1,100–1,500 kWh per month in summer, translating to monthly bills that frequently land between $375 and $525 before any credits or assistance programs.
Last verified: September 2026 by Helios Energy Global.
San Bernardino sits entirely within SCE territory — there is no LADWP service here, and the city does not have a municipal utility. That means every residential customer is subject to SCE's tiered baseline structure, time-of-use (TOU) pricing, and the Net Billing Tariff (NEM 3.0) for new solar installations. Understanding which rate plan you're on — and whether you qualify for assistance — is the fastest way to reduce your bill before you even consider solar.
Why San Bernardino electricity bills run so high
The Inland Empire heat is the core driver. San Bernardino regularly records summer highs of 100–108°F, and residential central air conditioning can account for 50–65% of a summer electricity bill. Compare that to coastal Los Angeles, where marine influence keeps cooling loads far lower. A home in Santa Monica might use 600–700 kWh in July; the same square footage in San Bernardino routinely consumes 1,200–1,500 kWh.
Layered on top of that heat load is SCE's rate structure. The utility uses a combination of a baseline allocation (a small daily allowance at a lower Tier 1 rate) and steeply tiered or time-differentiated pricing above that threshold. Once you exceed your baseline allocation — which happens fast in summer — every additional kilowatt-hour costs significantly more.
SCE rate plans available in San Bernardino in 2026
Most SCE residential customers are on one of three plans. SCE automatically enrolls new customers on TOU-D-4-9PM, but you can request a different plan.
| Rate Plan | Off-Peak (approx.) | On-Peak 4–9 PM (approx.) | Super Off-Peak (approx.) | Best For |
|---|---|---|---|---|
| TOU-D-4-9PM (default) | ~30–32¢/kWh | ~48–53¢/kWh | ~22–25¢/kWh (9 PM–8 AM) | Most households; moderate AC use |
| TOU-D-PRIME | ~28–31¢/kWh | ~52–57¢/kWh | ~18–21¢/kWh (midnight–6 AM) | EV owners; solar+battery customers |
| Tiered (D) | Tier 1: ~22–24¢/kWh | N/A (no time differentiation) | Tier 2: ~34–37¢/kWh | Low, consistent usage; rarely better for AC-heavy homes |
| CARE discount applied | ~30–35% off above rates | ~30–35% off above rates | ~30–35% off above rates | Income-qualified households |
| FERA discount applied | ~18% off above rates | ~18% off above rates | ~18% off above rates | Just above CARE income threshold |
All rates are approximate estimates based on SCE tariff filings effective mid-2026. Rates include delivery, generation, and applicable surcharges. Verify your exact rate on your SCE bill or at sce.com.
TOU-D-4-9PM: the default plan
This is where most San Bernardino households land. The 4–9 PM on-peak window is painful in summer because it overlaps exactly with the hottest part of the afternoon — when your AC is working hardest and the grid is most stressed. Running a 4-ton central AC unit (roughly 4.8 kW) for three hours during that window costs approximately $0.72–$0.85 per hour at peak rates, or $2.15–$2.55 for that three-hour block alone, every day.
TOU-D-PRIME: better for solar + battery owners
TOU-D-PRIME has a higher on-peak rate but a dramatically lower super off-peak rate (midnight–6 AM). If you have a battery that charges overnight and discharges during the 4–9 PM peak, this plan can significantly improve your economics. We'll walk through the math below.
CARE and FERA: income assistance programs worth checking
SCE's CARE (California Alternate Rates for Energy) program provides roughly a 30–35% discount on your entire bill if your household income falls at or below 200% of the federal poverty level. For a family of four, that threshold is approximately $62,400/year in 2026 (income limits adjust annually — verify current figures at sce.com/care).
FERA (Family Electric Rate Assistance) applies an approximately 18% discount for households of three or more with incomes between 200% and 250% of the federal poverty level.
In a city where median household income is below the California average, a meaningful share of San Bernardino residents qualify for one of these programs. If you're not enrolled and think you might qualify, it takes about 10 minutes to apply online. This is the single fastest bill reduction available — before solar, before batteries, before anything else.
What a typical San Bernardino solar system looks like in 2026
Given the high AC load, most San Bernardino homes need a larger-than-average system to meaningfully offset their bill. A home using 1,200–1,400 kWh/month typically requires a 9–13 kW solar array to cover 90–100% of annual consumption.
At current installation costs of roughly $2.50–$3.50 per watt before incentives, that system runs approximately:
- 9 kW system: ~$22,500–$31,500 installed (estimate)
- 11 kW system: ~$27,500–$38,500 installed (estimate)
- 13 kW system: ~$32,500–$45,500 installed (estimate)
Important for 2026 buyers: The 30% federal residential solar tax credit expired December 31, 2025. There is no federal tax credit for a solar system installed in 2026. This is a real change from prior years — any installer or website telling you otherwise is out of date. Factor this into your payback math.
San Bernardino does benefit from excellent solar resource — NREL data shows approximately 5.5–5.8 peak sun hours per day in the Inland Empire, which is meaningfully better than coastal LA. That higher production partially offsets the loss of the federal credit by improving your system's output per dollar invested.
NEM 3.0 math for San Bernardino: why a battery changes everything
New solar installations in SCE territory fall under NEM 3.0 (the CPUC Net Billing Tariff). This is a critical difference from what solar customers installed before April 2023 experience. Under NEM 3.0, excess solar energy exported to the grid is credited at a wholesale avoided-cost rate — roughly 5–8¢/kWh during most hours — rather than the retail rate you pay to import power.
For a San Bernardino home, this creates a specific problem: your solar panels produce most aggressively from 10 AM to 3 PM, but your peak consumption (and the grid's peak pricing) hits from 4–9 PM. Without a battery, you export cheap midday solar and then buy back expensive peak power. The math doesn't work as well as it did under legacy NEM.
With a battery, the calculation flips. A typical scenario for a San Bernardino home:
- Solar generates 50–60 kWh on a summer day
- Battery (10–13 kWh usable capacity) charges from solar between 11 AM–3 PM
- Battery discharges during 4–9 PM peak, displacing ~$2.50–$3.00 worth of 52¢/kWh power per day
- Remaining solar that can't be stored is exported at the low NEM 3.0 rate
On TOU-D-PRIME, the spread between the super off-peak rate (~18–21¢/kWh, which is what you'd use to charge the battery if solar is insufficient) and the on-peak rate (~52–57¢/kWh) is roughly 30–36¢/kWh. Every kWh your battery shifts from peak to off-peak saves that spread.
A single home battery (installed cost approximately $14,000–$18,500) paired with solar can meaningfully improve the economics of a NEM 3.0 system in San Bernardino specifically because of the extreme peak pricing and long summer peak hours. For a deeper breakdown of solar-only vs. solar+battery under NEM 3.0, see our solar vs. battery NEM 3.0 guide.
What about SGIP battery rebates?
The California Self-Generation Incentive Program (SGIP) historically offered rebates for home batteries. As of 2026, SGIP residential incentive budgets are waitlisted — not actively funded for most new residential applicants. We track this program and will notify consultation clients if funding reopens. Do not assume SGIP will reduce your battery cost when running your numbers today.
How San Bernardino compares to other Southern California utility territories
This localization matters. If you're comparing notes with a neighbor in Pasadena or a family member served by LADWP, you're not on the same playing field:
- LADWP (Los Angeles): Average rate roughly 28¢/kWh — significantly lower than SCE. LADWP also still offers retail-rate net metering, not NEM 3.0. Solar economics there are meaningfully different.
- Pasadena Water & Power: Municipal utility, own net metering program, not subject to NEM 3.0.
- SCE (San Bernardino, Rancho Cucamonga, Fontana, Ontario, Redlands): ~34–35¢/kWh average, NEM 3.0 applies to all new solar, peak TOU rates above 50¢/kWh.
San Bernardino's combination of high SCE rates + extreme heat load + excellent solar resource actually makes it one of the stronger cases for solar + battery in Southern California — the economics just require honest NEM 3.0 math rather than legacy assumptions. Explore our locations page for city-specific notes across the region.
Frequently asked questions about San Bernardino electricity rates
What is the average electric bill in San Bernardino in 2026?
A typical single-family home in San Bernardino runs roughly 1,100–1,500 kWh/month in summer and 700–900 kWh/month in winter. At SCE's blended rate of approximately 34–35¢/kWh, that produces summer bills of roughly $375–$525 and winter bills of $240–$315. Homes with pools, EVs, or older HVAC systems frequently run higher.
Is San Bernardino served by SCE or LADWP?
San Bernardino is entirely within Southern California Edison (SCE) territory. LADWP serves the City of Los Angeles and a few adjacent areas, but does not serve San Bernardino. This matters significantly for net metering: SCE customers with new solar are on NEM 3.0, while LADWP customers still receive retail-rate net metering. See our NEM 3.0 guide for a full comparison.
How do I reduce my SCE bill in San Bernardino without solar?
The fastest steps, in order: (1) Apply for CARE or FERA if income-eligible — a 30–35% discount is the biggest single lever available. (2) Shift discretionary loads (dishwasher, laundry, EV charging) to before 4 PM or after 9 PM to avoid peak rates. (3) Raise your thermostat setpoint by 2–3°F during the 4–9 PM peak window and pre-cool before 4 PM. (4) Check whether your current rate plan (TOU-D-4-9PM vs. Tiered) is actually optimal for your usage pattern — SCE offers a free rate comparison tool.
Does the 30% federal solar tax credit apply to a 2026 installation in San Bernardino?
No. The 30% federal residential solar tax credit expired December 31, 2025. A solar system installed in 2026 does not qualify for any federal income tax credit. This is a significant change from prior years and affects payback period calculations. California does not currently offer a statewide solar income tax credit to replace it. Review current incentives with a licensed installer before making any financial assumptions.
How many solar panels does a San Bernardino home typically need?
A home using 1,200 kWh/month needs roughly a 9–11 kW system to cover most of its annual consumption, given San Bernardino's strong solar resource of approximately 5.5–5.8 peak sun hours per day. That typically translates to 22–28 panels depending on panel wattage (most current panels are 400–430W). A custom solar design will give you a precise number based on your roof, shading, and actual usage history.
Is a battery worth it in San Bernardino under NEM 3.0?
For most San Bernardino homes, yes — more so than in many other California markets. The combination of high peak TOU rates (50–57¢/kWh), long summer peak windows (4–9 PM daily), and NEM 3.0's low export credits creates a strong case for storing solar energy rather than exporting it. A battery costing $14,000–$18,500 installed can meaningfully improve solar payback by capturing that peak-rate spread. Run the numbers with a battery-specific consultation.
What happens to my SCE rate if I add an electric vehicle?
SCE offers an EV-specific rate plan (TOU-EV-1) that may be worth evaluating if you charge at home. It features a very low overnight rate (roughly 14–18¢/kWh, midnight–9 AM) designed for EV charging, but a higher peak rate. If you have solar and a battery, TOU-D-PRIME often pencils out better than TOU-EV-1 for combined solar+EV households — but the right answer depends on your specific usage profile. This is worth discussing in a free consultation.
Next steps
- Book a free consultation and custom solar design — no obligation, no pressure, just honest numbers for your specific San Bernardino home
- See what a solar system costs for your home — current 2026 pricing ranges with and without battery
- Understand your NEM 3.0 export credits — what SCE actually pays for your excess solar
- Solar vs. battery under NEM 3.0 — the Inland Empire math in plain English
- Explore home battery options — installed costs, capacity, and which systems work with SCE's TOU plans
- See all Southern California locations we serve — SCE vs. LADWP vs. municipal utility breakdowns by city
More guides
Best Solar Companies in Manhattan Beach, CA (2026): Aesthetics-First Installs for South Bay's Most Valuable Homes
Manhattan Beach runs on SCE under NEM 3.0, and its premium architecture demands more than a commodity install. Here's an honest, numbers-first ranking of the best solar companies serving the South Bay's most competitive market in 2026.
ReadElectricity rates in Riverside in 2026: RPU vs SCE explained
Riverside Public Utilities charges roughly 18–21¢/kWh in 2026 — meaningfully cheaper than SCE's 34–35¢ average in neighboring cities — and its near-retail net metering makes solar payback significantly faster.
ReadBest Solar Companies in Lake Forest, CA (2026): An Honest Guide for OC Homeowners
A straight-talking, numbers-first guide to the top solar installers serving Lake Forest, CA in 2026 — covering SCE net billing, real pricing, battery logic, and what to ask before you sign.
ReadGet a free consultation and custom design.
No pressure, no obligation — the owner reviews every design we send.