What uses the most electricity in a home in 2026?
Air conditioning tops the list, accounting for roughly 25-40% of a typical Southern California home's annual electricity use — here's the full ranked breakdown.
By Taylor Crouse — Founder, Helios Energy GlobalUpdated
Quick answer
- Air conditioning is the single largest load in most SoCal homes, responsible for roughly 25–40% of annual electricity use — higher than the national average because of our climate.
- Water heating (electric resistance or heat pump) runs 15–20% of annual consumption; an EV adds roughly 250–400 kWh per month depending on miles driven.
- A typical SoCal home uses 700–1,200 kWh per month before any efficiency upgrades.
- Reducing your biggest loads before sizing solar can shrink your required system by 1–3 kW and save thousands upfront.
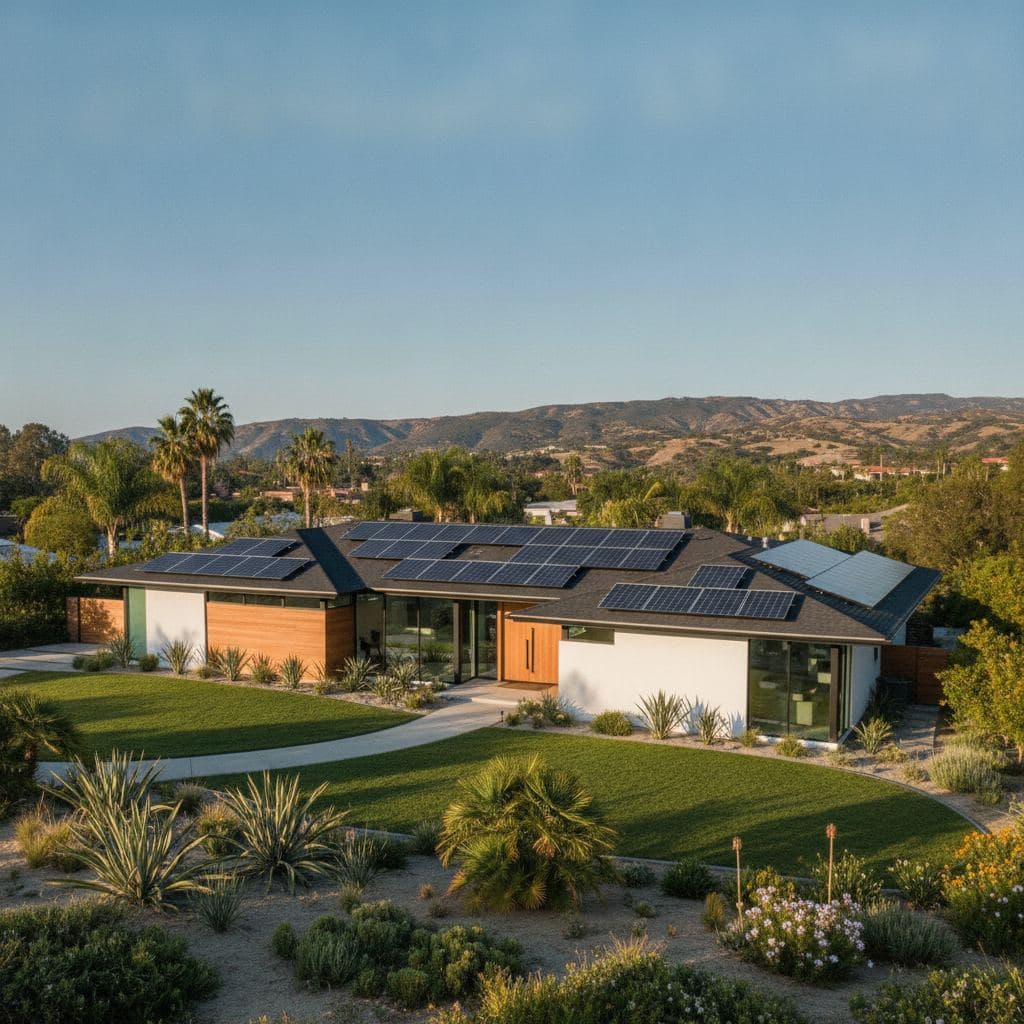
In a typical Southern California home, air conditioning alone accounts for roughly 25–40% of the annual electricity bill — noticeably more than the national average because of our warm, dry summers and mild winters that keep AC running longer. Water heating, EV charging, and pool equipment together can easily add another 40–50% on top of that, meaning just four appliance categories drive the majority of what you pay SCE or LADWP every month.
Last verified: September 2026 by Helios Energy Global.
The ranked breakdown: where your kilowatt-hours actually go
Understanding your load profile is the foundation of good solar design. A system sized to cover a 900 kWh/month home needs roughly 1–2 fewer panels than one sized for 1,200 kWh/month — and that difference compounds over 25 years of production. Here's how the major loads stack up for a typical SoCal single-family home.
| Load | Typical Monthly kWh (SoCal) | % of Bill (est.) | Peak-Hour Risk (SCE TOU 4–9 PM)? | Notes |
|---|---|---|---|---|
| Central AC / heat pump | 200–500 kWh | 25–40% | ✅ High | Highest in Jul–Sep; pool of load for battery dispatch |
| Electric water heater | 150–250 kWh | 12–20% | ✅ Moderate | Heat pump water heaters cut this by ~60% |
| EV charging | 200–400 kWh | 15–30% | ✅ High if unmanaged | Managed overnight charging avoids SCE peak |
| Pool pump | 100–300 kWh | 8–20% | ✅ High if daytime | Variable-speed pump + timer = major savings |
| Refrigerator(s) | 30–60 kWh | 2–5% | Low | Runs 24/7 but low wattage |
| Washer + dryer | 30–80 kWh | 2–6% | Moderate | Gas dryer cuts electric share significantly |
| Lighting | 20–50 kWh | 2–4% | Low | LED conversion already done in most homes |
| Miscellaneous (TV, devices, etc.) | 50–100 kWh | 4–8% | Low | Vampire loads matter here |
All figures are estimates based on EIA residential consumption data and California Energy Commission appliance profiles. Your actual usage will vary by home size, occupancy, and equipment age.
Air conditioning: the SoCal wildcard
Nationally, space cooling averages around 15–17% of residential electricity use. In Southern California — particularly the Inland Empire, San Fernando Valley, and areas east of the 405 — that number routinely climbs to 35–40% during summer months. Even coastal Santa Monica homes that rarely hit 90°F can see AC dominate bills during late-September heat events.
Why this matters for solar sizing: AC load is largely daytime load, which aligns well with solar production. But under SCE's TOU rates (~34–35¢/kWh at peak, 4–9 PM), running AC in the evening without a battery means buying expensive grid power right when the sun has set. That's the core argument for pairing solar with storage — see our solar vs. battery guide for NEM 3.0 customers.
Quick wins before you size solar:
- Upgrade to a variable-speed heat pump: Modern units are 2–3× more efficient than older SEER 10–12 systems.
- Add a smart thermostat: Pre-cool to 72°F before 4 PM, let the house coast to 76°F by 9 PM. Zero peak-hour AC draw.
- Attic insulation and air sealing: Often reduces cooling load by 15–25% with paybacks under five years.
Electric water heating: the hidden second load
Many homeowners focus on AC and overlook their water heater. A standard electric resistance tank (4,500W element) running 2–3 hours per day adds 150–250 kWh per month — roughly $50–$85 on an SCE bill at average blended rates. LADWP customers pay less per kWh (~28¢/kWh effective) but the consumption is identical.
Heat pump water heaters (HPWHs) cut that load by roughly 60–70%, bringing monthly consumption down to 50–90 kWh. If you're replacing an old electric tank anyway, a HPWH reduces the solar system size you need — which is a better investment than simply adding more panels to cover an inefficient appliance. Check with LADWP or SCE directly for any current rebate programs; incentive budgets change frequently.
EV charging: the load that changed everything
An EV driving the average Southern California commute (~35–40 miles/day) consumes roughly 250–400 kWh per month, depending on the vehicle's efficiency. That's equivalent to adding a second refrigerator, a pool pump, and a water heater combined. For many households, EV adoption is the single event that tips them from "solar makes sense" to "solar is essential."
SCE customers: Unmanaged Level 2 charging during the 4–9 PM peak can add $40–$80/month in peak charges alone. SCE's EV-specific rate plans (TOU-D-PRIME) incentivize overnight charging — set your car to charge after 9 PM and you're largely in the off-peak window.
LADWP customers: LADWP's net metering still credits excess solar at retail rates, so solar-charged EVs pencil out especially well. LADWP's EV rate options also reward overnight charging.
A properly sized solar system can offset most or all of your EV charging if you plan for it upfront. Tell your designer your current or planned EV situation — this is one of the most common reasons we see systems undersized. Start with a custom design that accounts for your actual driving habits.
Pool pumps: the Southern California extra
This one doesn't appear on national lists, but in SoCal it's real. A single-speed 1.5 HP pool pump running 8 hours/day consumes roughly 250–300 kWh/month. At SCE rates, that's $85–$105/month just to circulate water.
Variable-speed pump upgrade: Cuts pool pump consumption by 60–80%, often to 50–90 kWh/month. California's Title 20 standards now require variable-speed pumps on new installations, but millions of older single-speed units are still in the ground.
Scheduling tip: Run the pump during peak solar production hours (10 AM–3 PM) to consume your own generated power rather than grid electricity. This is especially valuable under NEM 3.0 for SCE customers, where exported solar is credited at much lower avoided-cost rates rather than retail.
Reduce first, then size your solar system
The sequence matters. If you right-size your loads before getting solar quotes, every efficiency improvement translates directly into a smaller (cheaper) system with the same bill-offset result.
A practical order of operations:
- Pull 12 months of utility bills — most SCE and LADWP accounts show this in the app. Note your highest month.
- Identify your top two loads from the table above. Are you running an old AC unit? Single-speed pool pump? Resistive water heater?
- Make the cheap efficiency moves first: smart thermostat, pool pump timer, EV charging schedule.
- Plan for what's coming: If you're buying an EV in the next 2 years, size solar for that load now.
- Then get your solar quote — based on your optimized consumption, not your current wasteful baseline.
This approach typically reduces required system size by 1–3 kW, saving $2,500–$10,500 at current installed costs of roughly $2.50–$3.50/watt. Explore solar panel costs and sizing to see how load reduction affects your quote.
What about batteries?
If you're on SCE (NEM 3.0 applies to you), a battery isn't just about backup — it's about avoiding peak rates from 4–9 PM. Charge the battery from solar during the day, discharge it during the evening peak, and you can dramatically reduce what you buy at 34–35¢/kWh. Installed battery costs run roughly $14,000–$18,500 per unit in 2026. SGIP residential incentives are currently waitlisted, so don't count on that offset in your near-term budget.
LADWP customers on retail-rate net metering have a different math: exported solar is credited at retail, so the battery ROI case is more about backup than rate arbitrage. Learn more about batteries to see which scenario fits your utility and load profile.
Frequently asked questions about home electricity use
What appliance uses the most electricity in a home?
In most Southern California homes, central air conditioning is the top electricity consumer, typically accounting for 25–40% of annual use. Nationally the figure is lower (~15–17%), but SoCal's climate pushes it higher, especially in inland areas where summer temperatures regularly exceed 100°F.
How many kWh per month does a typical SoCal home use?
A typical single-family home in Southern California uses roughly 700–1,200 kWh per month, with the wide range driven by home size, number of occupants, whether there's a pool, and EV charging. Homes with EVs and pools frequently exceed 1,200 kWh in summer months.
Does an EV really add that much to my electric bill?
Yes — an EV driving a typical SoCal commute adds roughly 250–400 kWh per month, which at SCE's average blended rates translates to $85–$140/month in additional electricity cost. The good news: solar can offset most of that, and overnight charging avoids SCE's 4–9 PM peak rates.
Should I reduce my electricity use before going solar?
Generally, yes — at least for the big-ticket inefficiencies. Replacing a single-speed pool pump or an old AC unit before sizing solar means you need fewer panels to achieve the same offset, which reduces upfront cost. However, don't delay solar indefinitely chasing efficiency upgrades; the two efforts can run in parallel.
Does a pool pump use a lot of electricity in California?
A standard single-speed pool pump running 8 hours/day uses roughly 250–300 kWh/month — comparable to adding a second EV to your home. Upgrading to a variable-speed pump (now required by California's Title 20 for new installs) cuts that to 50–90 kWh/month, a reduction of 60–80%.
How does my utility (SCE vs. LADWP) affect which loads matter most?
The loads are the same, but the financial stakes differ. SCE customers pay ~34–35¢/kWh at peak (4–9 PM), so large loads run during that window — unmanaged EV charging, AC, pool pumps — cost significantly more. LADWP customers pay ~28¢/kWh on average with a flatter rate structure, which softens the peak-hour penalty but also means solar export credits are lower per kWh than SCE's pre-NEM 3.0 era. See how net metering rules differ by utility.
Will solar cover all of my home's electricity use?
Solar can be sized to offset 80–110% of your annual consumption, but it won't cover every moment — you'll still draw from the grid at night or on cloudy days unless you have battery storage. The goal is to design a system matched to your actual annual load, accounting for current and planned loads like EVs or pool equipment. Use our design tool to model your specific home.
Next steps
- Book a free consultation and custom design — we'll pull your actual utility data and size your system around your real load profile, not a generic average.
- Estimate your solar costs and savings — see how load reduction affects system size and payback.
- Learn how batteries work with your loads — especially relevant if you're on SCE and want to avoid 4–9 PM peak charges.
- Understand NEM 3.0 and how it affects solar ROI — critical reading for SCE, PG&E, and SDG&E customers.
- Compare solar vs. battery strategies under NEM 3.0 — the tradeoffs explained with real numbers.
- See all Southern California service areas — we serve Santa Monica and surrounding communities across SoCal.
More guides
Can you add an Enphase or Tesla battery to solar another company installed? (California, 2026)
Yes — Tesla Powerwall 3 and, since August 2026, Enphase's IQ Battery 10C both AC-couple to solar systems installed by other companies, including orphaned Freedom Forever, SunPower and Titan systems; expect $14,500–$18,500 installed for one Powerwall 3 and no change to your NEM 2.0 status if you don't add panels.
ReadWhat's the Average Electric Bill in Temecula? (2026)
Temecula homes use around 900 kWh a month — well above the California average — and typical SCE bills run $270–$390, with big newer homes with pools passing $500 in summer. Here's the breakdown by home size and why the 4–9 PM peak window matters so much here.
Read20 kW Solar System Cost in California (2026): Price, Production and Who Needs One
A 20 kW solar system installed in California runs $50,000–$70,000 before financing — here's what you get for that, who actually needs this size, and how SCE vs. LADWP changes the math.
ReadGet a free consultation and custom design.
No pressure, no obligation — the owner reviews every design we send.