How much do solar panels cost in the Inland Empire in 2026?
Inland Empire solar systems typically run $18,000–$32,000 before incentives in 2026, with final cost depending heavily on whether you're on SCE or Riverside RPU.
By Taylor Crouse — Founder, Helios Energy GlobalPublished
Quick answer
- Inland Empire solar installs run approximately $17,500–$42,000 for a typical home (7–12 kW system) before any incentives in 2026.
- At $2.50–$3.50 per watt installed, a 10 kW system lands roughly $25,000–$35,000 before rebates.
- SCE customers pay ~34–35¢/kWh and export under NEM 3.0 at much lower rates; Riverside RPU customers pay ~21¢/kWh with ~9¢/kWh export under their own net metering program.
- The federal 30% solar tax credit expired December 31, 2025 — there is no federal credit for a 2026 purchase.
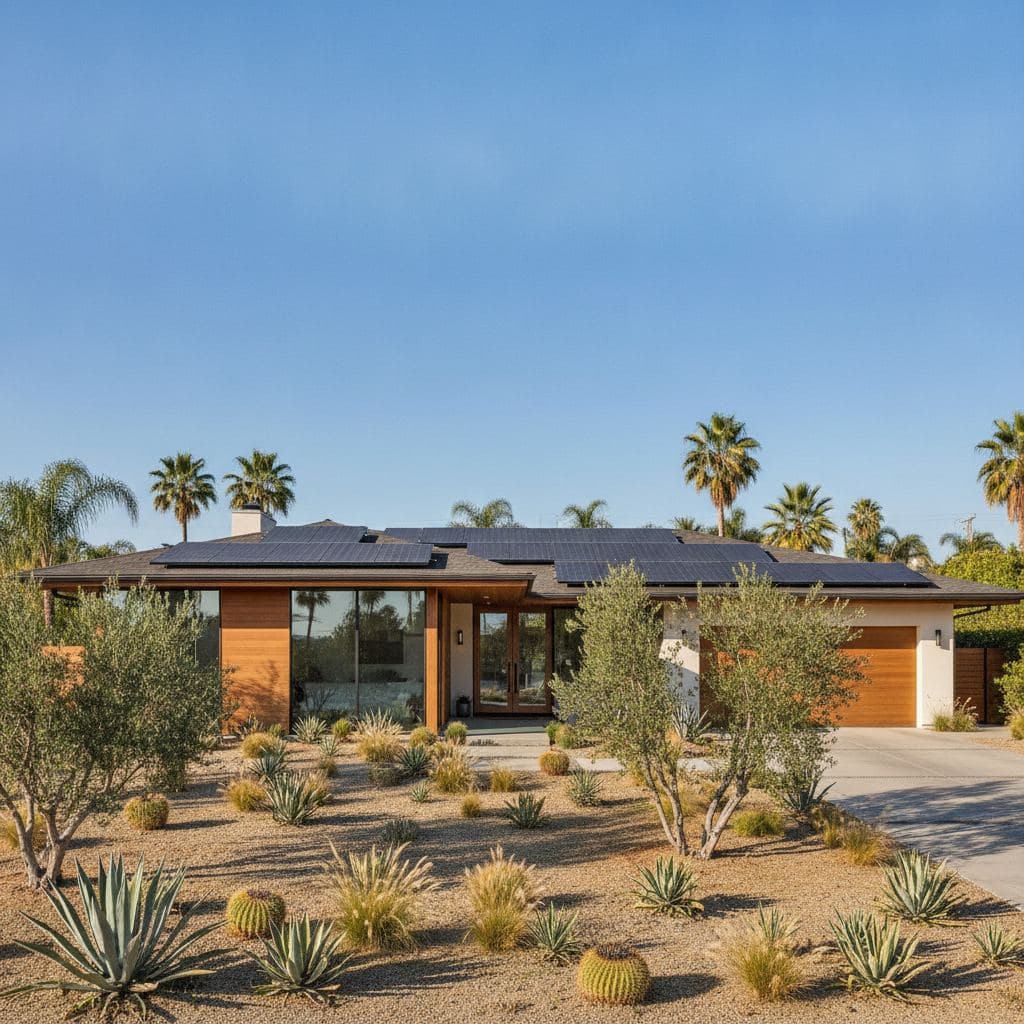
A typical 8–10 kW solar system in the Inland Empire costs $20,000–$35,000 installed before any local incentives, at an industry-wide rate of roughly $2.50–$3.50 per watt. Because Inland Empire summers routinely push 100°F+, most homes need larger systems than coastal California — plan for 10–14 kW if you're running central AC heavily from June through September.
Last verified: September 2026 by Helios Energy Global.
Why the Inland Empire is different from coastal SoCal
Two things drive up both your electricity bill and your solar system size in the Inland Empire: heat and rates.
Temperatures in Riverside, San Bernardino, Temecula, and surrounding cities regularly exceed 105°F in summer. A 2,000 sq ft home that might use 700–800 kWh/month in Santa Monica can easily consume 1,100–1,500 kWh/month in Redlands or Moreno Valley during peak cooling months. That higher baseline consumption means you need more panels to offset a meaningful share of your bill.
At the same time, which utility serves your address changes everything about the economics. SCE covers most of the Inland Empire, but the City of Riverside is served by Riverside Public Utilities (RPU), a municipal utility with its own rate structure and its own net metering program — not NEM 3.0.
SCE vs. Riverside RPU: the numbers side by side
| Factor | SCE (most of IE) | Riverside RPU |
|---|---|---|
| Avg. residential rate (2026 est.) | ~34–35¢/kWh | ~21¢/kWh |
| Peak TOU window | 4–9 PM daily | Varies by rate plan |
| Net metering program | NEM 3.0 / Net Billing Tariff | RPU Net Metering (retail-rate credit) |
| Export credit rate | ~5–9¢/kWh (avoided cost basis) | ~9¢/kWh (estimate; confirm with RPU) |
| Typical 10 kW system cost (installed, before incentives) | $25,000–$35,000 est. | $25,000–$35,000 est. |
| Estimated simple payback — solar only | 9–13 years est. | 12–17 years est. |
| Estimated simple payback — solar + battery | 10–15 years est. | 13–18 years est. |
| SGIP battery rebate (2026) | Waitlisted | Waitlisted |
All figures are estimates. Payback depends on system size, shading, financing method, and actual usage. Confirm current RPU export rates directly with Riverside Public Utilities.
The federal tax credit is gone — here's what that means for 2026
This is the single most important financial change for Inland Empire buyers this year. The 30% federal residential clean energy credit expired on December 31, 2025. A system that would have saved you $7,500 in federal taxes in 2025 saves you $0 in federal taxes if you install in 2026.
That's not a reason to avoid solar — the math still works for many homeowners, especially SCE customers paying 34–35¢/kWh. But it does mean you need to run honest numbers, not 2024-era payback estimates that assumed a 30% subsidy.
Check DSIRE and your utility's website for any current California state or local incentives. We do not quote rebate amounts we cannot verify in real time.
Heat derating: why your system produces less than the spec sheet says
This catches a lot of Inland Empire buyers off guard. Solar panels are rated at 25°C (77°F). When your roof surface hits 65–75°C on a July afternoon in Riverside — which it will — panel output drops by roughly 10–25% compared to the nameplate rating, depending on the panel's temperature coefficient.
Practical implications:
- Size up. A system spec'd to cover 100% of your usage at STC (standard test conditions) may only cover 80–90% in real IE summer conditions.
- Panel choice matters. Panels with a temperature coefficient of -0.26%/°C or better (some premium monocrystalline lines) lose less output in heat than budget panels rated at -0.40%/°C or worse.
- NREL's PVWatts tool uses local weather data to model real-world production — always ask your installer to show you a PVWatts or equivalent simulation, not just a nameplate calculation.
At Helios, every custom design we run for Inland Empire homes uses location-specific temperature data, not generic California averages.
System sizing for the Inland Empire
Because of high AC loads and heat derating, Inland Empire homes typically need larger systems than equivalent square footage on the coast.
Rough sizing guide (estimates only):
- 1,400–1,800 sq ft home, moderate AC use: 7–9 kW system → ~$17,500–$31,500 installed
- 1,800–2,400 sq ft home, heavy AC use: 10–13 kW system → ~$25,000–$45,500 installed
- 2,400+ sq ft home, pool or EV charger: 13–16+ kW system → $31,000–$52,000+ installed
These are rough ranges. Your actual usage history — ideally 12 months of utility bills — is the only reliable starting point. See our solar page for more on how we size systems.
SCE customers: NEM 3.0 changes the battery math
If you're on SCE, you're on the Net Billing Tariff (NEM 3.0). Under this structure, solar energy you export to the grid is credited at the avoided cost rate — roughly 5–9¢/kWh — not the retail rate you pay to import power. That's a significant gap when you're paying 34–35¢/kWh to buy power but only getting 5–9¢ for what you send back.
The practical result: self-consumption is far more valuable than export. A battery lets you store afternoon solar production and use it during the 4–9 PM peak window instead of exporting it cheaply and buying it back expensively.
Battery costs in 2026: Installed battery storage runs approximately $14,000–$18,500 per unit for a standard home battery. SGIP (the California battery rebate program) residential budgets are waitlisted in 2026 — do not plan your budget around receiving SGIP funds.
For a deeper look at how NEM 3.0 affects your decision, see our NEM 3.0 guide and solar vs. battery under NEM 3.0.
Riverside RPU customers: a different calculation
If your address is within the City of Riverside, you're served by Riverside Public Utilities, a municipal utility. RPU runs its own net metering program and is not subject to NEM 3.0. RPU's retail net metering credits exported solar at approximately 9¢/kWh (verify current rates with RPU directly, as municipal rates change independently of CPUC proceedings).
The trade-off: RPU's base rate of ~21¢/kWh is significantly lower than SCE's ~34–35¢. That means each kWh of solar you produce offsets less dollar value, which extends your payback period compared to an equivalent SCE customer. The system costs the same to install; the savings accumulate more slowly.
RPU customers should still model solar carefully — you're still avoiding 21¢/kWh, which is real money — but the economics are more sensitive to system cost and financing terms. Book a free consultation and we'll run the actual numbers for your address.
Financing options and what they do to total cost
- Cash purchase: Highest upfront cost, lowest total cost over 25 years. With no federal tax credit in 2026, the cash math is straightforward.
- Solar loan: Spreads cost over 10–25 years. Watch for dealer fees baked into the loan that inflate the effective system price by 15–30%.
- Lease / PPA: You don't own the system. Monthly payments are typically lower than a loan, but you capture no equity and resale complications arise. We don't offer leases — we think ownership serves most homeowners better.
Whatever financing path you choose, ask your installer for the all-in price per watt so you can compare apples to apples. See solar panel cost for a full breakdown of what's included in a quality install.
Roof considerations in the Inland Empire
Inland Empire homes skew toward tile roofs — both concrete and clay — which require specialized mounting hardware and add $500–$1,500 to install costs versus a simple comp-shingle roof. If your roof is within 5–7 years of needing replacement, do it before going solar; removing and reinstalling panels later costs $250–$350 per panel at Helios — about $5,000–$7,000 for a 20-panel system.
Flat or low-slope roofs (common on commercial and some ranch-style homes) can work well with ballasted racking. See our roof types page for specifics. South- and west-facing roof sections are most valuable in the IE given the late-afternoon peak load profile.
Frequently asked questions about solar panel cost in the Inland Empire
What's the average cost of solar in Riverside, CA in 2026?
A typical residential system in Riverside runs $19,000–$32,000 installed before any incentives, at roughly $2.50–$3.50 per watt. Riverside is served by RPU (a municipal utility), not SCE, so your net metering credits and payback period will differ from neighbors in unincorporated Riverside County who are on SCE.
Is there still a federal solar tax credit in 2026?
No. The 30% federal residential solar tax credit expired on December 31, 2025. There is no federal income tax credit available for residential solar systems installed in 2026. Do not rely on any quote or sales pitch that includes a 30% federal credit — it no longer applies.
How many solar panels does an Inland Empire home need?
Most IE homes need 24–40 panels (400W class), depending on usage and roof space. Heavy AC use, pools, and EV charging all push system size up. Heat derating means you should size for roughly 10–15% more capacity than a raw usage calculation suggests. A custom design using your actual bills is the only reliable way to know.
Does extreme heat hurt solar panel performance in the Inland Empire?
Yes, measurably. Solar panels lose roughly 0.3–0.4% of output per degree Celsius above 25°C. On a 110°F day in San Bernardino, roof surface temperatures can reach 70°C+, reducing output by 15–20% compared to the nameplate rating. This is why proper system sizing using local weather data matters more in the IE than in coastal areas.
Is solar worth it on SCE in the Inland Empire without the federal tax credit?
For many homeowners, yes — SCE's ~34–35¢/kWh rate is high enough that solar still delivers meaningful savings even without the federal credit. The payback period is longer than it was in 2024–2025, but a well-sized system still offsets a large share of a high summer bill. Adding a battery improves economics under NEM 3.0 by maximizing self-consumption during the 4–9 PM peak.
Can I get the SGIP battery rebate in the Inland Empire in 2026?
SGIP residential battery rebate budgets are waitlisted as of mid-2026. You can apply to the waitlist, but you should not count on SGIP funds when building your budget. Check the CPUC SGIP page for current waitlist status.
How do I compare solar quotes in the Inland Empire?
Ask every installer for the price per watt (installed, all-in) and a PVWatts or equivalent production estimate using your specific address and roof orientation. Confirm whether the quote includes permits, interconnection fees, and monitoring. For SCE customers, ask how the proposal models NEM 3.0 export rates — not retail-rate export. For RPU customers, confirm the installer knows you're on RPU net metering, not NEM 3.0.
Next steps
- Book a free consultation and custom design — we'll pull your utility data, model your roof, and give you a real number for your address, not a range.
- See how we design and size systems — our process explained.
- Explore battery storage options — especially relevant for SCE customers on NEM 3.0.
- Understand NEM 3.0 and how it affects your export credits
- Solar vs. battery under NEM 3.0: what the math actually shows
- Full solar panel cost breakdown — what's included, what's not, and how to read a quote.
- Our Inland Empire and Southern California service areas
More guides
Are ground-mounted solar panels worth it in California? Cost, footprint and permits (2026)
Ground-mounted solar in California runs roughly $0.35–$0.75 per watt more than rooftop ($3,500–$7,500 extra on 10 kW), needs about 600–1,000 sq ft of yard for 10 kW, and always goes through standard plan check because SolarAPP+ covers roof mounts only.
ReadAre Free Solar Quote Sites Legit? An Installer Explains Who Really Pays (2026)
Free solar quote sites are (mostly) legitimate — but 'free' means installers pay for your contact info, at $25 to $300 a lead, and that cost lives somewhere in your price. An installer compares EnergySage, SolarReviews, Angi/HomeAdvisor, and Home Depot's program, flags the red and green flags, and gives you a vetting checklist that works no matter where a quote came from.
ReadDo ADUs Need Solar Panels in California? Title 24 Rules, Sizing and Exceptions (2026)
Newly built detached ADUs generally require a solar PV system sized by Equation 150.1-C under California's 2025 Energy Code — typically 1.8–4 kW for most Southern California backyard units — while garage conversions, attached additions, and JADUs are exempt.
ReadGet a free consultation and custom design.
No pressure, no obligation — the owner reviews every design we send.